

A structured sales KPI list drives B2B performance by measuring output at each funnel stage: prospecting, qualification, opportunity, closing, and retention. A team tracking 8-12 well-chosen KPIs has full visibility without attention dilution, versus 30-50 scattered metrics that hurt readability. This article proposes a sales KPI list organized in 5 categories (activity, conversion, revenue, cycle, retention) with tracking frequency, calculation source, and alert threshold. Unlike a broader B2B sales process view, this KPI list focuses on operational daily metrics for SDR, AE, and RevOps teams.
For sales managers, revenue leaders, RevOps chiefs, or executives structuring commercial reporting, this article details the 12 reference KPIs, tracking methodology, and 3 FAQ.
On the agenda:
- The 12-KPI principle (less but better)
- 3 activity KPIs (prospecting volume)
- 3 conversion KPIs (stage rates)
- 3 revenue KPIs (pipeline and ACV)
- 2 cycle KPIs (sales velocity)
- 2 retention KPIs (NRR, churn)
- How to define alert thresholds per KPI
- Reporting frequency (daily, weekly, monthly)
- 3 FAQ (KPI count, volume vs quality trade-off, tracking tool)
Key takeaways:
- 12 KPIs is the sweet spot: enough to cover the funnel, not too many to stay readable
- 3 priority categories: activity (funnel entry), conversion (efficiency), revenue (output)
- Reporting frequency: daily (SDR activity), weekly (conversion), monthly (revenue and retention)
- Alert thresholds: define 3 levels per KPI (green / orange / red) rather than a single target
- Classic mistake: tracking 30-50 scattered metrics → no action triggered
- Recommended tracking tool: native CRM (Salesforce, HubSpot, Pipedrive) + BI dashboard (Looker, Metabase) for aggregation
1. The 12-KPI principle
Why cap at 12
A commercial dashboard with 30-50 metrics rarely gets read. Managers look at the top 5 and ignore the other 45. A KPI list capped at 12 indicators structured in categories stays readable in 3-5 minutes each morning.
The 12 split across 5 categories following the funnel: - Activity: 3 KPIs - Conversion: 3 KPIs - Revenue: 3 KPIs - Cycle: 2 KPIs - Retention: 2 KPIs Total: 13, often reduced to 11-12 through contextual grouping.
The 3-level principle
Each KPI answers a question at a different level: - Daily operational (SDR/AE): what did I do today? - Weekly tactical (manager): where’s it blocked this week? - Monthly strategic (executive): are we on the annual trajectory?
A KPI placed at the right level serves the decision it triggers. A revenue KPI watched daily creates noise; an activity KPI watched monthly arrives too late.
The alert threshold rule
A single target (« conversion rate 12% ») produces little action. A 3-level threshold (green > 10%, orange 7-10%, red < 7%) triggers differentiated actions: green = continue, orange = investigate, red = immediate escalation.
This 3-tier segmentation is the mark of mature dashboards vs frozen Excel tables.
2. The 3 activity KPIs
KPI 1: touches per SDR per day
Counts total outbound interactions (email sent, call made, LinkedIn message) per SDR each day. Typical 2026 threshold: 60-100 touches/day for a standard outbound SDR.
Source: CRM or sales engagement tool (Outreach, Salesloft, Zeliq). Frequency: daily (SDR sees it in personal dashboard). Alert: green > 80, orange 60-80, red < 60.
KPI 2: new accounts contacted per week
Measures coverage. An SDR redoing 5 touches on the same 20 accounts spins in circles. Broad funnel opening requires continuously entering new accounts.
Typical threshold: 30-60 new accounts/week/SDR. Frequency: weekly (Monday review). Alert: green > 40, orange 25-40, red < 25.
KPI 3: reply rate by channel
Compares email vs LinkedIn vs phone performance. A low rate on one channel signals a message or targeting problem, not activity.
Typical threshold: email 5-12%, LinkedIn 15-30%, phone 20-40%. Frequency: weekly (enables fast message adjustment). Alert: green if in range, orange if -20%, red if -40%.
3. The 3 conversion KPIs
KPI 4: MQL → SQL rate
Measures qualification. A marketing lead becomes a sales-vendable lead after SDR qualification. This rate reveals marketing generation quality.
Typical threshold: 25-45%. Frequency: weekly. Alert: > 35% green, 20-35% orange, < 20% red (marketing sends noise).
KPI 5: SQL → Opportunity rate
Measures post-qualification SDR work quality. An SQL that doesn’t become an opportunity indicates poor fit or loose qualification.
Typical threshold: 40-60%. Frequency: weekly. Alert: > 50% green, 35-50% orange, < 35% red.
KPI 6: Opportunity → Signature rate (win rate)
The closing rate. How many qualified opportunities become signed deals.
Typical threshold: 20-35% in B2B mid-market, 10-25% in enterprise. Frequency: monthly (long sales cycle). Alert: highly segment-dependent; benchmark vs peers.
4. The 3 revenue KPIs
KPI 7: pipeline created per month
Sum of opportunity values created during the month. Leading indicator of future revenue.
Typical threshold: 3-5× monthly revenue target (to absorb win rate). Frequency: monthly. Alert: green if > 4× target, orange 3-4×, red < 3×.
KPI 8: average ACV (Annual Contract Value)
Annualized average value of signed contracts. Track upmarket or downmarket trajectory.
Typical threshold: depends on segment. Continuous rise indicates successful upmarket, decline may signal excessive discounting. Frequency: monthly. Alert: ±20% vs quarterly baseline.
KPI 9: revenue per SDR per quarter
Economic efficiency of each SDR. Compares team member contributions.
Typical threshold: depends on segment ($150-400K/year typical in mid-market SaaS). Frequency: quarterly. Alert: below 60% of team median = coaching needed.
5. The 2 cycle KPIs
KPI 10: average sales cycle
Number of days between opportunity created and deal signed. A lengthening cycle signals complications (buying committee, budget, priority).
Typical threshold: 30-60 days SMB, 60-120 days mid-market, 120-240 enterprise. Frequency: monthly. Alert: green if stable/decreasing, orange if +15%, red if +30% vs previous quarter.
KPI 11: pipeline velocity
Formula: (# opportunities × ACV × win rate) / sales cycle. Combines 4 dimensions into a single « throughput » indicator.
Frequency: monthly. Useful to project expected revenue and detect structural blockers.
6. The 2 retention KPIs
KPI 12: Net Revenue Retention (NRR)
Sum of recurring revenue kept + expansion on existing customer base from 12 months ago. NRR > 100% = growth without acquisition.
Typical 2026 threshold: > 100% baseline, > 115% top-quartile B2B SaaS. Frequency: quarterly. Alert: NRR drop = absolute Customer Success priority.
KPI 13: monthly logo churn
Number of customers lost relative to total. Complements NRR (which masks churn if expansion offsets).
Typical threshold: < 1%/month SMB, < 0.5%/month mid-market, < 0.2%/month enterprise. Frequency: monthly. Alert: exceeding threshold for 2 consecutive months = deep investigation.
Zeliq and prospecting KPI tracking
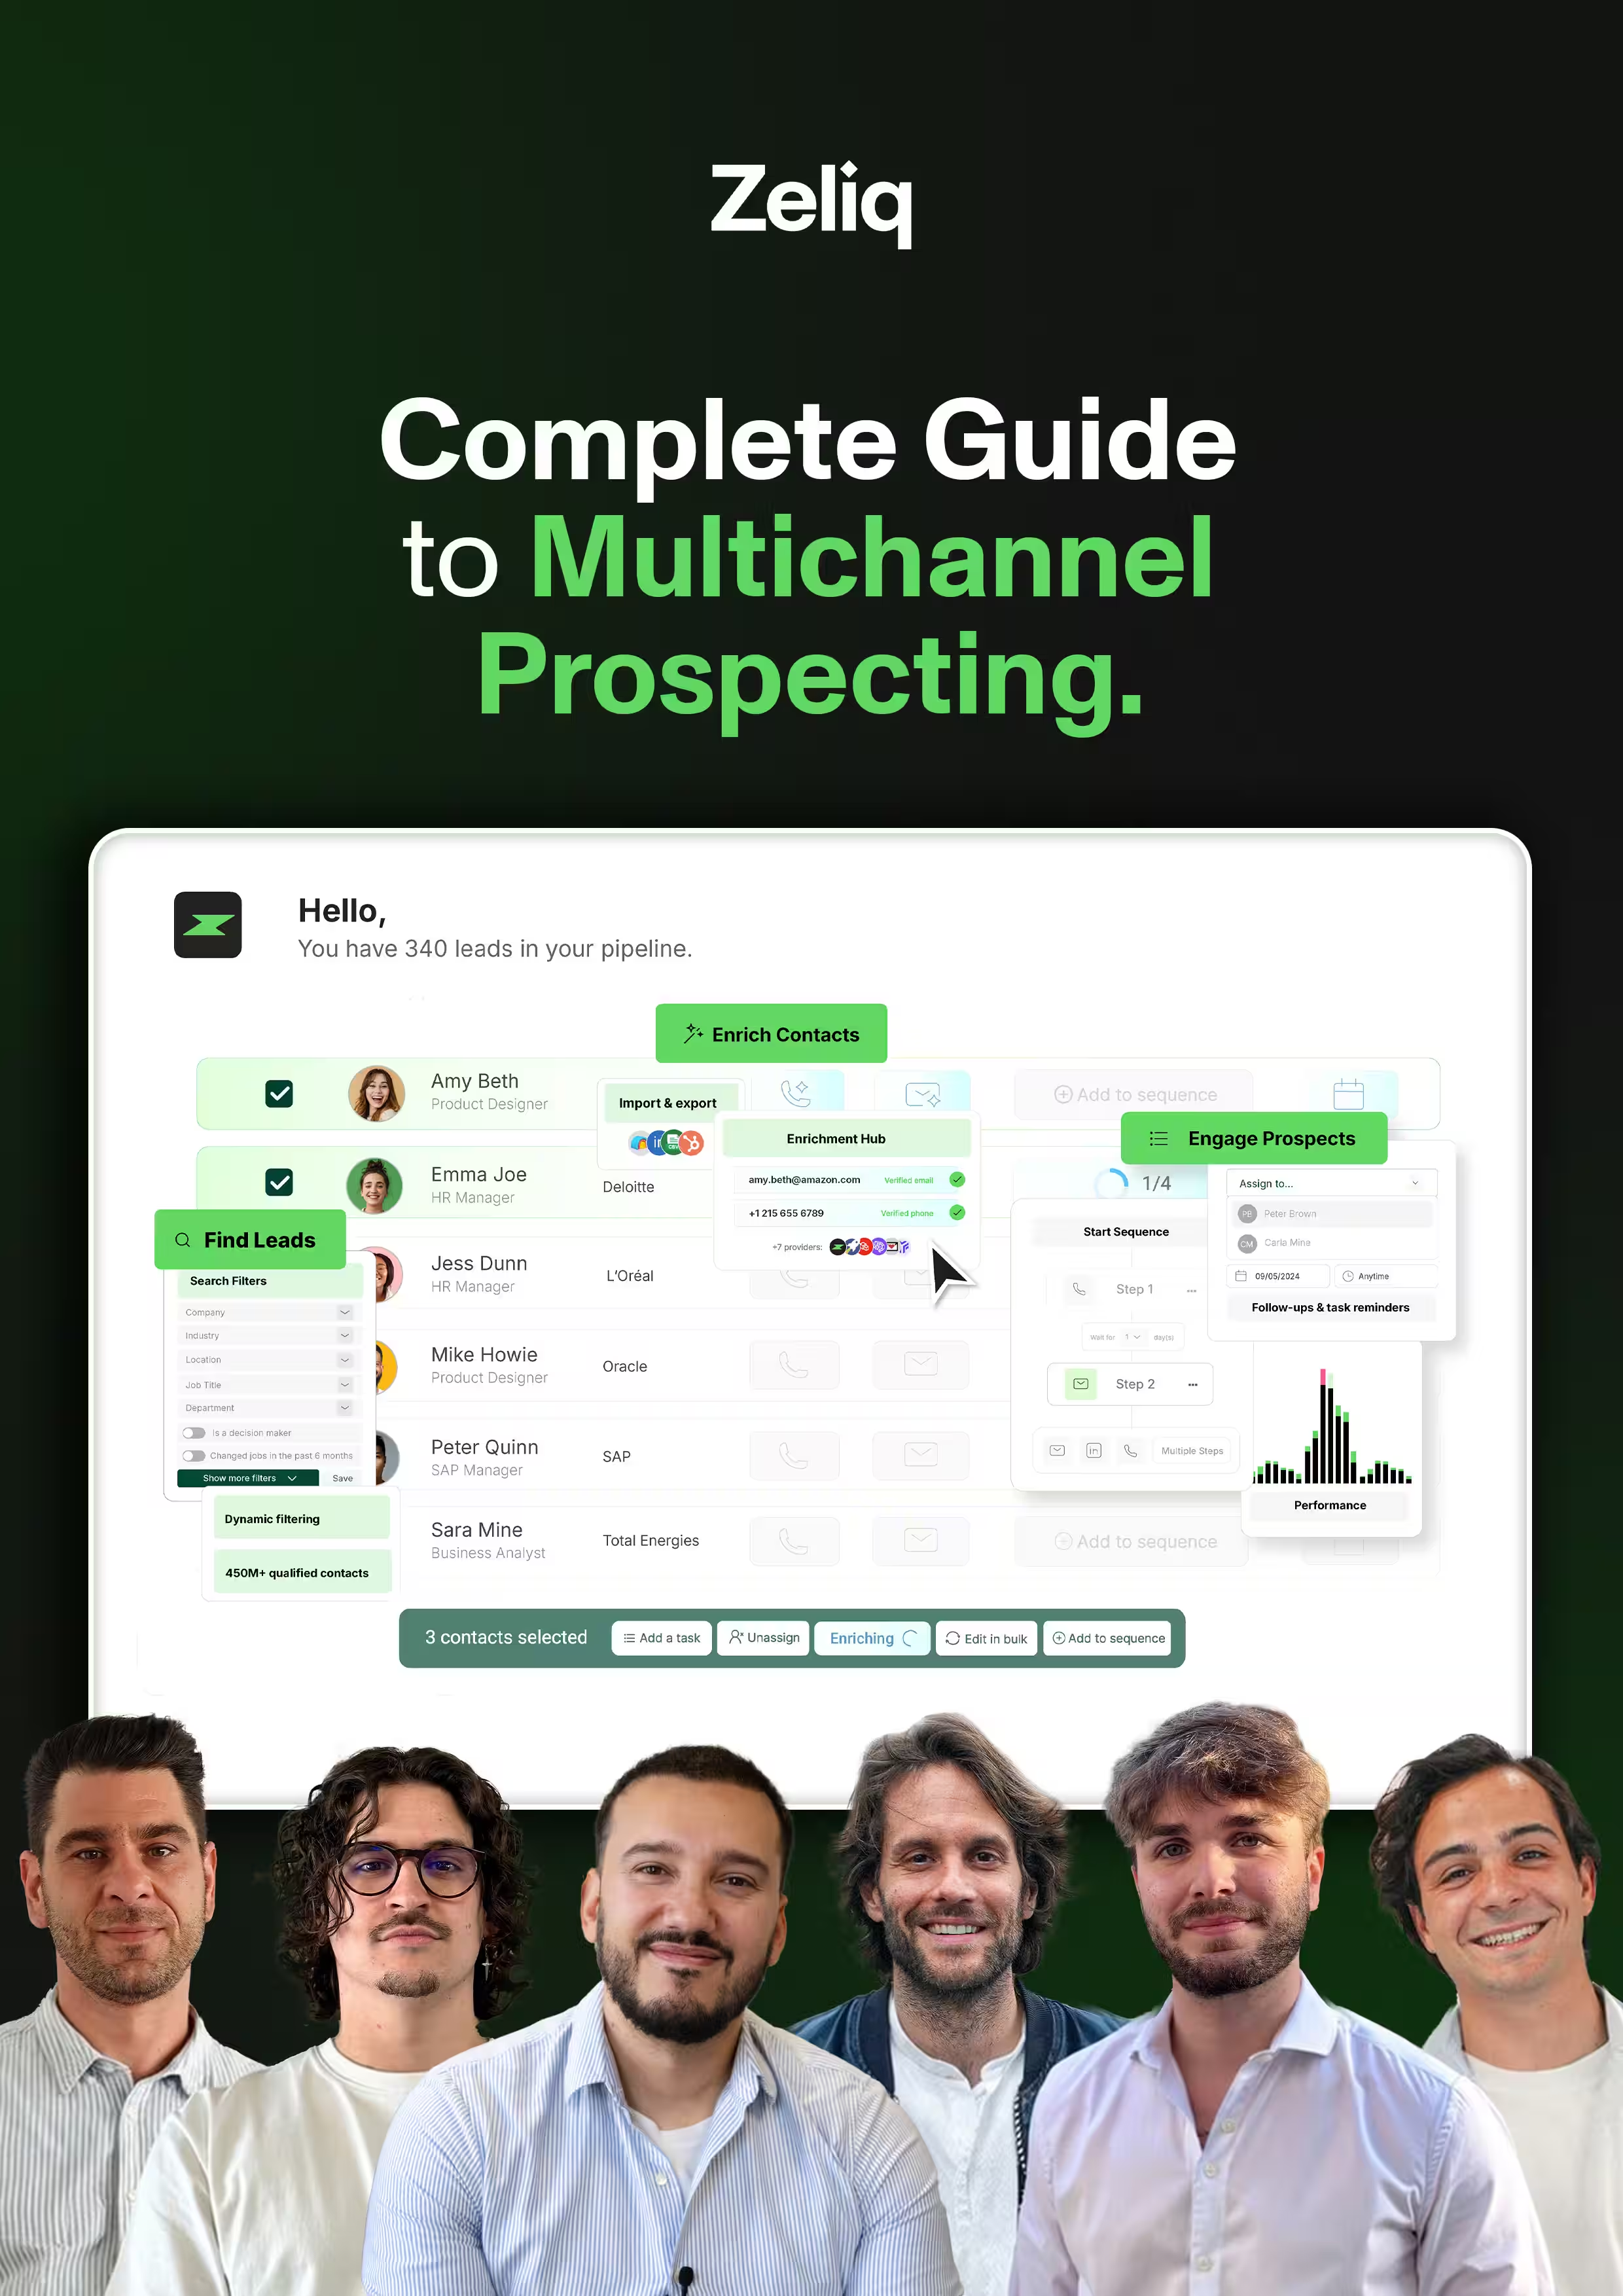
Zeliq combines a 450 million B2B contact database with waterfall enrichment, multichannel sequences, and integrated activity reporting. Activity-category KPIs (touches per SDR, accounts contacted, reply rate by channel) surface automatically in the dashboard, cutting manual reporting time by 4-6 hours/week.
7. Define alert thresholds per KPI
The 3-tier method
For each KPI, define 3 thresholds: - Green: performance meets or exceeds target - Orange: mild drift, investigation required - Red: strong drift, escalation needed
Red should be rare (< 10% of time) to stay actionable. An all-red dashboard produces resignation, not action.
The rolling baseline method
Calculate each threshold on a rolling 3-6 month baseline to absorb seasonality and team learning. A fixed annual threshold becomes obsolete by month 3.
Communicate thresholds to the team
A KPI whose thresholds are unknown to SDRs/AEs themselves drives nothing. Publish the 12 KPIs and thresholds in a shared doc, revise quarterly.
8. Reporting frequency
Daily (SDR/AE self-service)
3 activity KPIs in each SDR’s personal dashboard. Morning check, immediate adjustment if under threshold.
Weekly (team manager)
3 conversion KPIs + 2 cycle KPIs. Monday team review, individualized coaching plan if an SDR exits thresholds.
Monthly (revenue leader)
3 revenue KPIs + 2 retention KPIs. Monthly commercial review meeting, structural decisions (hiring, reallocation, discount policy).
Quarterly (executive)
Synthetic view of the 12 KPIs + cross-ratios (CAC payback, LTV/CAC). Strategic decisions (new market, team restructuring).
9. Frequently asked questions
How many commercial KPIs should you track at maximum?
12 KPIs is the sweet spot: enough to cover the entire funnel without attention dilution. Below 8, visibility is missing on at least one stage (activity, conversion, revenue, cycle, or retention). Above 15, attention dilutes and important KPIs drown among accessory metrics. The 12 rule breaks down into 3 activity KPIs (funnel input), 3 conversion KPIs (transformation efficiency), 3 revenue KPIs (output), 2 cycle KPIs (velocity), 2 retention KPIs (long-term health). This structure forces category-by-category thinking rather than ad hoc metric additions. Classic antipattern: a dashboard with 40-60 metrics aggregated from CRM exports without prioritization. Result: managers look at the top 5 in the list and ignore the rest. Alternative for very structured teams: keep the 12 pilot KPIs + a library of 20-30 deep-dive metrics used only when a main KPI signals an anomaly. This separation of current dashboard vs on-demand analytics avoids dilution while preserving analytical depth.
Prioritize activity volume or conversion quality as KPI?
Track both, but arbitrate differently by team maturity and target segment. A junior early-stage SDR team must first master volume (touches/day, accounts contacted/week) to build operational reflexes; prioritize activity KPIs during the first 3-6 months. A mature team already hitting volume thresholds must pivot to conversion quality (SQL rate, win rate, cycle) to optimize per-touch profitability. Common 2026 trap: pushing volume beyond quality threshold, mechanically lowering conversion and burning target accounts. Simple rule: if volume is green and conversion drops, priority shifts to quality (message, targeting, training). If volume is red and conversion is green, priority returns to volume. A team jointly optimizing volume + conversion on the 6 KPIs (3 activity + 3 conversion) finds the equilibrium point in 2-3 quarters. Enterprise segment: prioritize quality (win rate, ACV, cycle) over volume as each account is strategic. Transactional SMB segment: prioritize volume to absorb structurally lower conversion rates.
What tool to recommend for tracking commercial KPIs?
Native CRM for collection (Salesforce, HubSpot, Pipedrive) + a light BI tool for aggregation (Looker, Metabase, Google Data Studio). The CRM is the source of truth for raw data (opportunities, activities, revenues). It produces native reports correctly but poorly adapted to a multi-KPI synthetic commercial dashboard. A light BI tool connected to the CRM enables building a multi-screen dashboard (SDR view, manager view, revenue leader view) with the 12 KPIs and color-coded thresholds. Typical cost: Metabase open source free, Looker Studio free with limits, Looker paid $30-100/user/month. Alternative for non-technical teams: Zeliq and similar tools embed their own prospecting KPI dashboards (touches, replies per channel, meetings booked) covering the 3 activity KPIs and 1-2 conversion KPIs without exports. For revenue and retention, a CRM like HubSpot Sales Hub Pro or Salesforce Sales Cloud with native reports suffices for SMB/mid-market teams. Enterprise with multiple revenue sources (subscription + services + partners): dedicated BI tool essential.
10. Conclusion: 3 actions to run
Audit your current dashboard within 7 days. How many KPIs? Grouped by category? 3-tier thresholds set? If > 20 KPIs without structure, priority rebuild.
Select your 12 pilot KPIs within 15 days. Use the 3+3+3+2+2 structure (activity, conversion, revenue, cycle, retention). Document tracking frequency and threshold per KPI.
Institute weekly conversion KPI review within 30 days. 30 min every Monday manager + team, actionable decisions on orange/red thresholds. This simple ritual boosts team conversion 15-25% over 6 months.
Automate tracking of your prospecting activity KPIs
Zeliq combines 450 million B2B contacts, multichannel sequences, and integrated prospecting KPI reporting (touches, replies, meetings booked). 4-6 hours/week recovered on manual reporting. Account created in 2 minutes.
Try for freeAnd if you want to automate your prospecting KPI tracking without manual exports, try Zeliq for free: sourcing, multichannel sequences, and integrated KPI dashboards in one interface, no credit card required.