
A B2B sales KPI is a quantified indicator that measures the performance of a salesperson, a team, or a process over a defined period. To qualify as a true KPI (rather than reporting noise), a metric must meet three tests: it must be objectively measurable, it must trigger an operational decision when it deviates, and it must connect to revenue. Anything else is a vanity metric.
This guide walks through the 15 KPIs that genuinely move the needle in 2026, organized in four families (activity, efficiency, outcome, profitability). For each one, you get the formula, the realistic benchmark, and the action to take when the indicator goes red. Teams tracking 5 to 7 core KPIs hit on average 91 percent of quota, versus 73 percent for teams tracking fewer than 4.
What’s inside
- What a sales KPI actually is, and what it is not
- The 4 families of B2B sales KPIs
- The 15 activity, efficiency, outcome and profitability indicators
- Worked example: dashboard rebuild on a 6-person RevOps team
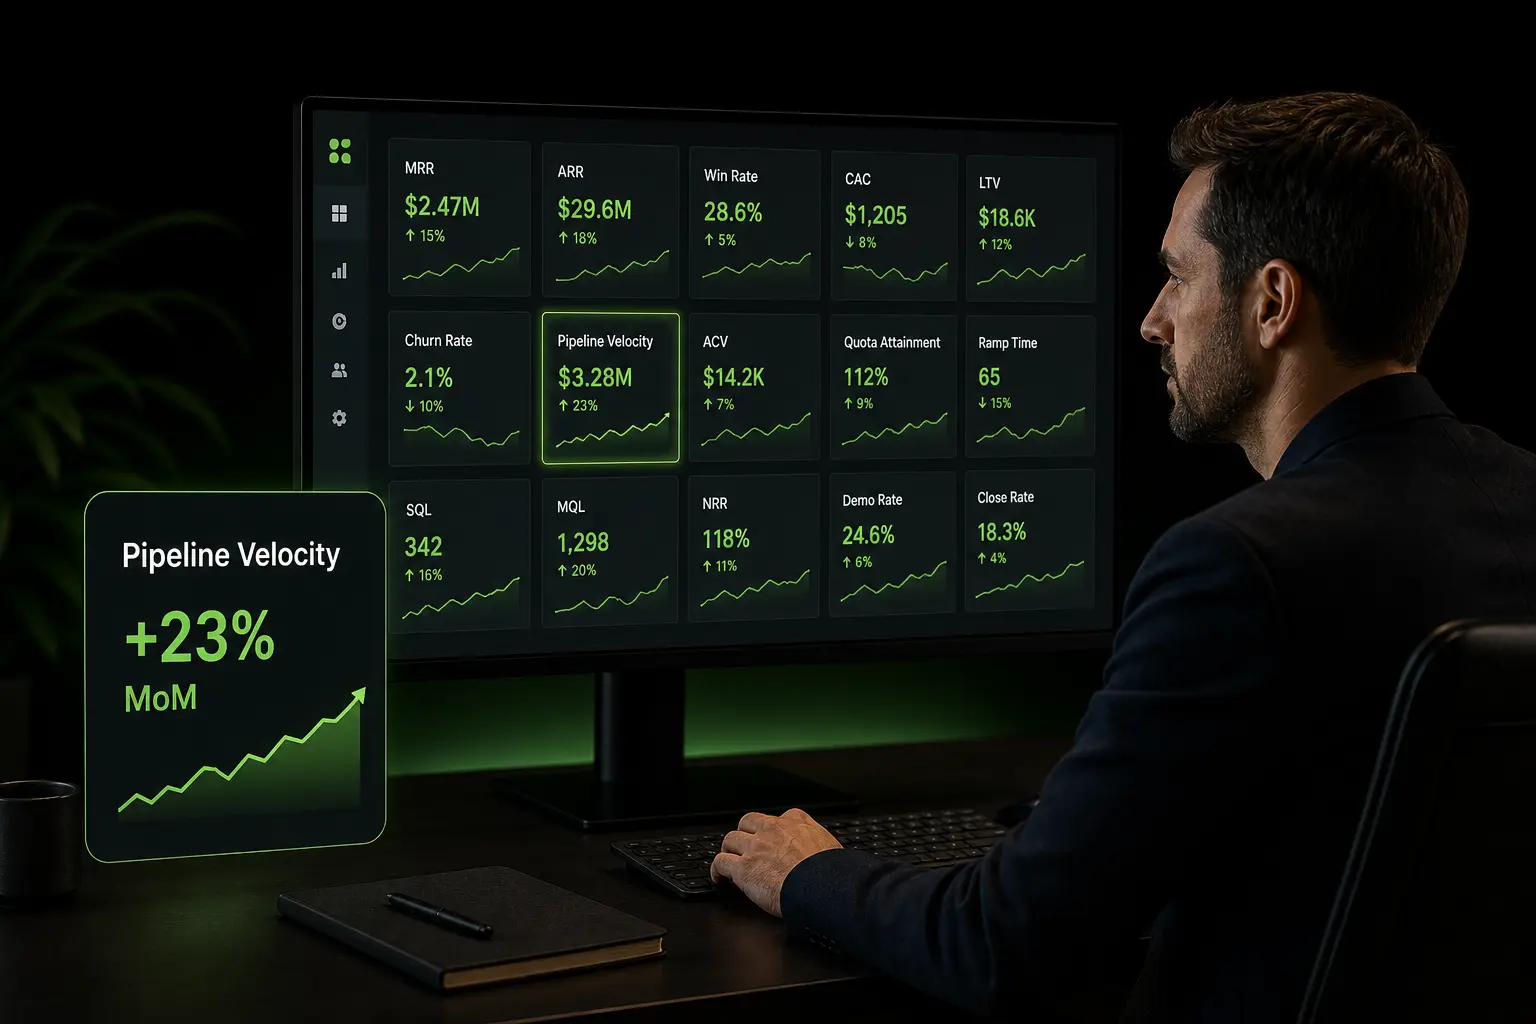
- How to build an actionable sales dashboard
- The 3 most common KPI mistakes to avoid
- 3 FAQs and 3 dated next steps
Key takeaways
A useful KPI checks three boxes: measurable, actionable, revenue-aligned. Track 5 to 7 core indicators max, not 30. Cover all four families (activity, efficiency, outcome, profitability) to avoid blind spots. 2026 benchmarks: pipeline coverage 3x to 5x, mid-market B2B win rate 20-25 percent, CLV/CAC ratio above 3, median cycle 60-90 days SMB / 90-180 days mid-market. Review your KPIs every quarter: what gets measured gets steered.
What a sales KPI actually is, and what it is not
A sales KPI is not a number you glance at in a weekly report to feel reassured. It is an operational indicator that must, every time it deviates, trigger a specific commercial action: recalibrate an SDR’s cadence, repivot an offer, drop a segment from the ICP, recoach an AE.
The primary function of a KPI is to act as an early warning signal. If your average sales cycle stretches from 60 to 85 days in a single quarter, it likely means your leads are less qualified or your pricing has introduced friction. If your win rate collapses from 25 to 14 percent, the competition shifted, your positioning blurred, or your AEs are missing objection-handling coaching.
A real KPI answers the question: “if this number moves, what do I do tomorrow morning?” If you have no answer, it is not a KPI, it is a reporting metric. The distinction matters because most B2B sales orgs track 20 to 40 different metrics but actually operate on 3 or 4.
The 4 families of B2B sales KPIs
Every balanced sales org covers four KPI families. Tracking only one family (revenue, typically) creates dangerous blind spots.
Activity KPIs: they measure the volume of effort produced by the team (calls made, emails sent, meetings booked). These are leading indicators. They predict tomorrow’s pipeline.
Efficiency KPIs: they measure the quality of effort (reply rate, stage-by-stage conversion rate, show rate). They reveal whether the machine works well or wastes energy.
Outcome KPIs: they measure commercial output (deals closed, revenue generated, average deal size, MRR/ARR). These are lagging indicators.
Profitability KPIs: they measure whether growth creates economic value (CAC, LTV, CLV/CAC ratio, payback period). Without them, you can grow fast and lose money.
A balanced dashboard ideally contains 1 or 2 KPIs per family, totaling 5 to 7. Beyond that, attention dilutes.
Activity KPIs: 4 must-track indicators
1. Effective calls per day per SDR
Formula: total effective calls (valid numbers, decision-maker or gatekeeper reached) divided by working days. Healthy 2026 B2B benchmark: 40 to 60 effective calls per day per SDR. Below 30, the cadence is too low to sustain consistent pipeline generation.
2. Outbound emails sent per week
Formula: weekly volume divided by number of SDRs. Benchmark: 150 to 250 personalized emails per SDR per week. Above 300, it is likely spray-and-pray and personalization quality drops.
3. LinkedIn touches per target account
Formula: interactions (profile view, like, comment, message) divided by number of accounts targeted. Benchmark: 2 to 4 touches per account per month in focused ABM.
4. Qualified meetings booked per SDR per month
Formula: qualified meetings held divided by number of SDRs. Benchmark: 10 to 20 qualified meetings per SDR per month. This is the hinge KPI between activity and outcome: it predicts next month’s pipeline.
Efficiency KPIs: 4 indicators that reveal quality
5. Stage-by-stage funnel conversion rate
Formula: prospects moving to stage N+1 divided by prospects entering stage N. Measure at every transition (lead, MQL, SQL, demo, proposal, close). A drop greater than 30 percent between two consecutive stages signals a friction point worth investigating immediately.
6. Outbound email reply rate
Formula: emails replied to divided by emails sent. 2026 B2B benchmark: 3 to 7 percent on mass cold email, 8 to 15 percent on hyper-personalized outreach. Below 2 percent, targeting or subject line needs rework.
7. Show rate (meeting attendance rate)
Formula: meetings held divided by meetings booked. Healthy benchmark: 60 to 80 percent. Below 50 percent, you are paying SDRs to book meetings that don’t happen, which kills AE morale and inflates acquisition cost.
8. Win rate
Formula: deals won divided by qualified pipeline opportunities. B2B mid-market benchmark: 20 to 25 percent. SMB: 30 to 40 percent. Enterprise: 10 to 20 percent. A sudden swing indicates a market shift, positioning drift, or a coaching gap.
Outcome KPIs: 4 revenue-oriented indicators
9. New revenue (New ARR / New Bookings)
Formula: revenue generated by new customers in the period. This is the ultimate output KPI for the new-business team. Always compare to quota and to the same period last year to gauge organic growth.
10. Average deal size (Average Contract Value)
Formula: total closed-won revenue divided by number of deals. A rising number signals successful upmarket motion. A falling number can mean price pressure, or a small-deal mix that dilutes commercial effort.
11. Average sales cycle length
Formula: average number of days between opportunity creation and close-won. B2B benchmark: 60-90 days SMB, 90-180 days mid-market, 180-360 days enterprise. Any lengthening above 20 percent in a single quarter deserves analysis.
12. Pipeline coverage
Formula: total pipeline value divided by period quota. Benchmark: 3x to 5x. Below 3x, you will miss quota. Above 5x, your pipeline probably contains hopium that needs cleaning.
Profitability KPIs: 3 financial indicators
13. CAC (Customer Acquisition Cost)
Formula: total sales + marketing cost in the period divided by number of new customers acquired. In B2B SaaS, average CAC sits between $1,000 and $8,000 for SMB, tens of thousands for enterprise. Track by segment and by channel to identify what actually pays back.
14. LTV and CLV/CAC ratio
LTV formula: average ARPU times gross margin, divided by churn rate. CLV/CAC: LTV divided by CAC. Benchmark: ratio above 3. Below that, your unit economics are strained. Above 5, you are likely under-investing in acquisition.
15. CAC payback period
Formula: CAC divided by monthly gross margin per customer. Healthy SaaS benchmark: 12 to 18 months. Above 24 months, unit profitability is compromised.
Zeliq and KPI-driven sales operations
Zeliq captures activity and efficiency KPIs in real time, the leading indicators that predict tomorrow’s pipeline: effective dials, emails delivered, reply rate, meetings booked, show rate. Raw data ships into HubSpot, Pipedrive, or Salesforce with mapping aligned to the 450 million B2B contacts database, eliminating SDR double entry and the gap between actual activity and what the CRM sees.
Concretely: a Head of Sales sees the activity/efficiency dashboard every morning without any SDR filling a Google Sheet. Outcome and profitability KPIs stay in the primary CRM.
Worked example: dashboard rebuild on a 6-person RevOps team
Take a typical mid-market B2B SaaS revenue ops team: 3 SDRs, 2 AEs, 1 RevOps. Before the rebuild, the team operated on a homemade dashboard with 22 indicators, only 5 of which were actually read each week. After collapsing to 6 core KPIs (one per family plus two trade-off indicators), three measured effects over 90 days:
| Operating metric | Before | After | Delta |
|---|---|---|---|
| KPIs tracked | 22 | 6 | -73% |
| Weekly forecast review duration | 75 min | 30 min | -60% |
| Time from deviation to corrective action | 14 days | 4 days | -10 days |
| Team quota attainment | 76% | 88% | +12 pts |
| Qualified meetings / SDR / month | 18 | 24 | +33% |
| AE win rate (90-day average cycle) | 21% | 24% | +3 pts |
The sharpest effect is not on raw numbers but on reaction speed. Going from 14 to 4 days between deviation (a show rate drop, for instance) and corrective action (SDR coaching, script tweak) reclaims roughly 10 days of productive output per month. At an average deal size of $13K ARR and 24 percent win rate, that acceleration is worth about $38K of incremental monthly ARR at the team level alone.
Rebuild cost: 4 days of senior RevOps time at $700/day = $2,800. Once, not monthly. Cash ROI over 12 months lands at roughly 11x the rebuild cost, before counting downstream gains on cycle length and forecast predictability. The best sales intervention of the year is often deleting 16 useless KPIs, not adding more.
How to build an actionable sales dashboard
A good dashboard fits on one page. Not a printed A4: a screen. If you have to scroll, you have too many KPIs or too much granularity.
Pick 5 to 7 indicators max, balanced across the four families. For each indicator, display three things: current value, target benchmark (your goal), and trend versus the previous period (week, month, quarter depending on the business rhythm). A green or red arrow next to the value saves 5 seconds of reading on 200 reads per month.
Set a review cadence: weekly for activity and efficiency KPIs (the team can still correct course), monthly for outcome KPIs, quarterly for profitability KPIs. The further downstream the KPI, the slower the review rhythm.
And above all: for every red KPI, assign a written action with an owner and a deadline. Otherwise the dashboard becomes a collective contemplation object that changes nothing.
The 3 most common KPI mistakes to avoid
Mistake 1: tracking too many KPIs. Human attention is finite. Beyond 7 main indicators, none are actually piloted. Run a quarterly pruning exercise: did this KPI trigger at least one operational decision in the past quarter? If no, drop it.
Mistake 2: confusing KPIs with vanity metrics. Number of LinkedIn followers, website visits, email opens: those are activity indicators, not sales KPIs. Until they translate to pipeline or revenue, they don’t belong on the sales dashboard.
Mistake 3: measuring without a benchmark. A KPI without a target is useless. “Win rate is 18 percent” means nothing if you don’t know whether the target is 25 percent or 12 percent. Define benchmarks per segment and per channel, and revise them each year against your actual market.
What are the most important B2B sales KPIs?
It depends on the company’s stage, but four KPIs are universally agreed in 2026: pipeline coverage (3x to 5x quota), win rate by segment (20-25 percent in mid-market), average sales cycle length (60-90 days SMB, 90-180 mid-market), and CLV/CAC ratio (above 3). Every other KPI is a leading indicator that predicts these four. If you have neither time nor resources, instrument these four first and add the rest later.
How do you measure sales performance in 2026?
Three filters separate a real KPI from a reporting metric: (1) measurable objectively, no interpretation, (2) actionable, meaning a deviation triggers a written operational decision, (3) revenue-aligned, tied to an ARR or cash target. Beyond 7 core KPIs per dashboard, attention dilutes. Run a quarterly review: did this KPI drive a concrete action in the past quarter? If no, drop it without remorse.
What is a good pipeline coverage ratio?
The accepted 2026 benchmark for healthy pipeline coverage is 3x to 5x the quota for the period. Below 3x, you will miss quota: there is not enough volume to absorb normal slippage and lost deals. Above 5x, you typically have stale hopium in the pipeline that needs cleaning, otherwise your forecast lies. Pipeline coverage should be computed by stage-weighted value, not raw value, and reviewed weekly during the last month of the quarter.
Pilot your sales KPIs on clean data
Zeliq centralizes activity, sequences, and conversion into one CRM-exportable view. Book a 20-minute demo.
Try for freeConclusion: 3 dated next steps
This week: list the KPIs your team actually checked over the last 30 days. You will likely find 15+ tracked indicators but fewer than 5 truly acted on. That is the basis for the rebuild.
Within 30 days: collapse the dashboard to 5-7 KPIs balanced across the 4 families. Define a numeric target for each and a fallback action if the KPI turns red. Document the decision in a shared wiki.
Within 90 days: automate the activity and efficiency KPI collection from your tools (CRM + sequencer + dialer). If you want to consolidate prospect data, activity, and conversion in a single platform, try Zeliq for free and measure the RevOps time saved within 14 days.