

Pipeline Generation: The 2026 Playbook for B2B Revenue Teams
Ask any VP of Sales what keeps them awake at night in 2026 and the answer rarely starts with closing. It starts with pipeline. Specifically, the gap between the pipeline they have and the pipeline they need to make their number. Closing is downstream of pipeline. Forecasting is downstream of pipeline. Hiring decisions, board updates, runway extensions, all downstream of pipeline.
That is why “pipeline generation” has quietly replaced “lead generation” as the central conversation in B2B revenue circles. The shift is not cosmetic. It reflects a deeper change in how go-to-market teams are measured: by sourced and accepted opportunities, not by raw lead counts that nobody downstream wants to inherit.
This guide walks through what pipeline generation actually is, how to source it across inbound, outbound, partnerships and expansion, the metrics that matter, the cadence of pipeline reviews, and the most common ways teams get it wrong. It is written for sales leaders, RevOps managers and founders who own a number and want a working blueprint, not a glossary.
What pipeline generation actually means
Pipeline generation is the set of activities, owned by sales, marketing and partnerships, that creates qualified sales opportunities of a defined value, expected to close within a defined window. The output is not a contact, not a lead, not even a meeting. The output is an opportunity in the CRM with a stage, an amount, a close date and a named decision maker.
That definition is narrow on purpose. A lot of teams generate activity and call it pipeline. Real pipeline survives stage gating: discovery confirmed, problem qualified, budget plausible, timeline real.
Pipeline generation vs lead generation vs demand generation
These three terms get used interchangeably and they should not. They sit in different layers of the funnel and they answer different questions.
Lead generation is the practice of capturing contact information from people who showed an early signal of interest. A whitepaper download, a webinar registration, a form filled out on a comparison site. The output is a lead record. Most leads never become opportunities.
Demand generation is the practice of creating awareness and intent inside an addressable market that did not know it had a problem, or did not know your category existed. Podcasts, thought leadership content, paid social, category-defining campaigns. The output is mental availability and inbound traffic.
Pipeline generation is the practice of converting that intent and those leads into qualified opportunities, plus the outbound and partner motions that create opportunities directly without ever passing through a lead stage. The output is sourced ARR.
The simplest way to remember it: lead gen fills the top, demand gen warms the market, pipeline gen builds the deals you will actually try to close.
Why pipeline generation is the 2026 obsession
Three forces have pushed pipeline gen to the top of the boardroom agenda.
First, revenue accountability has moved upstream. Marketing teams used to be measured on MQLs. In 2026, they are measured on sourced pipeline and sourced revenue. Sales teams used to be measured on closed-won. Now they are measured on self-sourced pipeline coverage too. When the metric becomes pipeline, the activity becomes pipeline gen.
Second, inbound volumes have softened in many B2B categories. SEO traffic gets eaten by AI overviews, paid CPMs keep climbing, gated content fatigue is real. Teams that overweighted inbound for the last decade are rebuilding outbound and partnership muscles to compensate.
Third, boards demand predictability. Pipeline coverage is the leading indicator that boards trust most. A team with 3.5x coverage entering a quarter has a credible plan. A team with 1.4x coverage entering a quarter is having a different conversation entirely. Pipeline gen is what moves that ratio.
Pipeline coverage: the 3x to 5x rule
Coverage ratio is the single most quoted number in pipeline reviews. It is the open pipeline divided by the quota for a given period. If your quarterly quota is 1M and your open pipeline is 3M, your coverage is 3x.
The folk wisdom is “3x coverage is healthy”. Reality is more nuanced.
| Motion | Typical coverage target |
|---|---|
| SMB, transactional, short cycle | 2x to 2.5x |
| Mid-market, 60 to 120 day cycle | 3x |
| Enterprise, 6 to 18 month cycle | 4x to 5x |
| ABM ultra-targeted | 2x to 2.5x |
Why the spread? Because coverage compensates for slippage. Long cycles slip more, no-decision rates climb in enterprise, and competitive deals stretch. SMB motions with high win rates can run lean. The right ratio for your team is the one that has historically converted to your number, not a number lifted from a benchmark report.
A practical rule: track your trailing-four-quarter conversion rate from open pipeline at week 1 of a quarter to closed-won by end of quarter. If 30 percent of week-1 pipeline closes, you need roughly 3.3x coverage to hit. If 22 percent closes, you need 4.5x. The math is unforgiving and personal to your business.
The six sources of pipeline
Pipeline does not come from one place. Healthy pipeline is portfolio-built across six sources, weighted differently depending on stage and motion.
1. Inbound (marketing-sourced)
Organic search, paid search, content, webinars, communities, review sites. Inbound captures buyers already in-market. It compounds slowly and pays back over years. Inbound pipeline tends to convert at higher rates than outbound because the prospect is self-qualifying.
2. Outbound (sales-sourced)
Cold email, cold calls, LinkedIn, multichannel sequences, ABM. Outbound creates pipeline that did not exist before, on your timing, against your ICP. It is the most controllable source. It is also the most expensive per opportunity if executed poorly.
3. Partnerships
Referral programs, technology integrations, channel partners, co-marketing. Partner-sourced pipeline often converts 2x to 3x better than other sources because the trust transfers from the partner. Volumes are typically modest and the relationship work is real.
4. Expansion
Cross-sell, upsell, multi-product attach, new logos inside an existing parent account. Expansion is the cheapest pipeline a B2B company will ever generate. Mature companies see 30 to 40 percent of net new ARR come from expansion.
5. Events
Field events, conferences, dinners, webinars, user groups. Events are slow and labor intensive but produce highly engaged opportunities and deal sizes that tend to be larger than the average inbound lead.
6. Community and word-of-mouth
Slack groups, Discord servers, founder networks, referrals from happy users. Hard to attribute, easy to underestimate. Most companies that scale past 50M ARR have a meaningful community-driven pipeline source even if their dashboards do not reflect it.
The mix shifts over time. Early-stage companies lean heavily on outbound and founder-led selling. Series B teams add inbound at scale. Mature companies see expansion and partnerships overtake net-new outbound.
Inbound pipeline generation in practice
Inbound is not “set up a blog and wait”. Inbound pipeline gen is a system with three layers.
Top of funnel: SEO and content. Long-form guides ranked for buyer keywords, comparison pages, alternative pages, integration pages. The goal is to be the page a buyer lands on the moment they start researching the category. Content here is written for buyers, not for everyone.
Middle of funnel: lead magnets and webinars. Templates, calculators, benchmarks, frameworks, live sessions. These convert anonymous traffic into known contacts. The conversion rate from session to lead matters less than the conversion rate from lead to sales-accepted opportunity.
Bottom of funnel: demo requests and product-led signals. “Book a demo” is the obvious one. The non-obvious ones are pricing page visits, multiple-stakeholder activity, integration page views, and free trial activations. These are the highest intent signals you have and they should fire alerts to sales the same day.
Inbound only generates pipeline if marketing and sales agree on what counts as a sales-accepted opportunity, with a written SLA on response time. 24 hours is too slow. The teams that win respond in under 5 minutes for high-intent signals.
Outbound pipeline generation in practice
Outbound is where pipeline gen gets operational. It is the single most controllable lever a sales team has.
Cold email is the volume backbone. Modern cold email lives or dies on three things: list quality, deliverability hygiene, and a one-line value proposition that survives a phone screen. The era of 200-word cold emails is over.
Cold call is undervalued. Calls connect at 5 to 10 percent in 2026 and conversations on those connects close meetings at 15 to 25 percent for trained reps. The math still works.
LinkedIn is the trust layer. Not as a primary channel, but as the warm-up and the credibility check. Connection request, content engagement, then an inMail or message that references the email. The buyer sees you in three places before they reply.
Multichannel sequences stitch these together. A typical 14-day sequence might run email day 1, LinkedIn view day 2, email day 4, call day 6, LinkedIn message day 8, email day 11, call day 14. The point is not the cadence template, it is the orchestration: each touch references the others, and reps spend their time on the buyers who showed signal, not on the next mechanical step.
ABM is the focused version of all of the above. A named list of 50 to 500 accounts, deep research on each, multithreaded outreach across 3 to 5 personas per account, coordinated with marketing ads and field events. ABM produces fewer opportunities at higher value, with longer cycles and better win rates.
If you want a single page on how the orchestration layer should work, the multichannel sequences breakdown covers the pattern in depth.
Allbound: the 2026 default
The most successful teams of 2026 stopped arguing about inbound versus outbound and adopted what is now called “allbound”: the same SDR or revenue rep works inbound demo requests, outbound prospecting and account expansion against the same target list, with shared signals and shared scoring.
Why allbound wins:
- A buyer who downloaded a whitepaper last month and just got hit by a competitor announcement is a hotter outbound target than a cold name on a list.
- An ABM target who visited the pricing page three times this week should not be sitting in the SDR queue at position 47.
- Inbound leads that go cold can be re-warmed with intent-driven outbound rather than discarded.
Allbound only works when intent signals from product, marketing, partnerships and outbound feed into one prioritization layer. That is what modern lead scoring is for.
The SDR motion in 2026
The SDR role has been pronounced dead more times than vinyl. It is not dead. It changed.
The 2026 SDR works a smaller list (200 to 400 named accounts, not 2,000 random names), spends more time on research per account, and is measured on sourced opportunities rather than meetings booked. Meetings booked still matter as a leading indicator, but the bonus check is tied to opportunities that the AE accepted.
A healthy SDR generates 8 to 15 sales-accepted opportunities per month in mid-market. Below 6 and the unit economics break. Above 18 and quality is probably suffering.
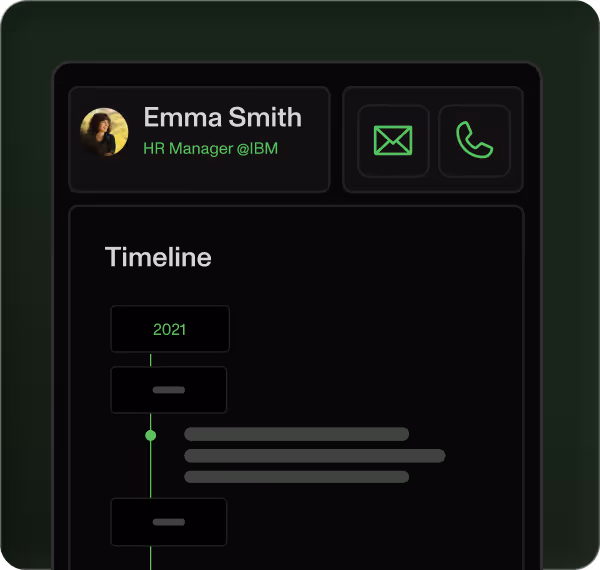
The other shift: SDRs no longer just hand off. The good ones stay in the deal as a co-pilot for the first two stages, attending discovery, helping with research, owning multithreading. That continuity raises win rates and shortens onboarding into AE roles.
RevOps as the pipeline architect
Pipeline generation is no longer a sales-only conversation. RevOps owns the architecture that makes pipeline gen measurable and repeatable.
What good RevOps does for pipeline gen:
- Defines the opportunity stages and the gating criteria for each, in writing, with examples.
- Builds the source attribution model so that every opportunity has a single source of truth.
- Owns the lead-to-opportunity SLA between marketing and sales.
- Maintains the lead scoring model and updates it quarterly based on closed-won analysis.
- Runs the pipeline review cadence and prepares the data that surfaces real questions.
Without RevOps, pipeline data lies. With RevOps, pipeline data tells you which channel to double down on next quarter. If you are designing the function from scratch, the RevOps use case page covers the toolset most teams settle on.
Scoring and handoff: the make-or-break detail
Two failure modes destroy more pipeline than any other: bad scoring and bad handoff.
Bad scoring means everyone in the system is treated as equally hot. An MQL that fits ICP is treated the same as a competitor employee who downloaded a whitepaper. SDRs work down the list in order of arrival, not in order of likelihood to convert. Quality compounds in the wrong direction.
Bad handoff means a marketing-qualified lead gets passed to sales with no context, sales waits 48 hours to call, the buyer has already moved on, and both teams blame each other in the next QBR.
The fix is mechanical:
- Score every contact and every account on fit and intent.
- Define explicit thresholds for marketing-accepted, sales-accepted and sales-qualified.
- Write a one-page SLA that says: who calls, in how long, with what context, and what happens if they do not.
- Review the SLA monthly with both teams in the room.
Implementing this without arguing is easier when scoring is automated against engagement signals rather than spreadsheet tags. Most modern teams use the same platform for lead scoring and sequence orchestration so the signals stay connected.
Pipeline coverage problems are usually scoring problems in disguise. If you have 4x coverage that converts to 12 percent of quota, you do not have a pipeline volume problem. You have a pipeline quality problem.
The metrics that matter
Pipeline generation has its own scoreboard. The teams that hit their number consistently track these religiously.
Coverage ratio. Open pipeline divided by quota for the period. Tracked weekly during a quarter, monthly outside of one. The ratio you need depends on your conversion history.
Pipeline velocity. The blended speed of revenue creation. The standard formula:
Velocity = (Number of opportunities x Win rate x Average deal size) / Sales cycle length
If velocity rises without volume rising, your team got better at closing or shortening cycles. If velocity rises only because volume rose, you spent more to get the same. Both are fine but they call for different next moves.
Win rate. Closed-won divided by closed (won plus lost plus no-decision). Track it by source, by segment, and by AE. Wide variance signals a coaching opportunity or an ICP mismatch.
Average selling price (ASP). The mean closed-won deal size. Trends matter more than absolute numbers. ASP creeping down quarter over quarter with stable volume is often a signal that the team is closing easier deals and avoiding harder ones.
Sales cycle length. Days from opportunity created to closed-won. The 90th percentile matters as much as the median: it tells you the tail risk in your forecast.
Source mix. What percent of pipeline came from each of the six sources. Concentration above 60 percent in any one source is a risk to flag, not a victory to celebrate.
Stage conversion rates. Stage 1 to stage 2, stage 2 to stage 3, etc. The biggest drop in your funnel is your highest-leverage problem.
Pick the metrics that match your motion. A short-cycle SMB business does not need to obsess over enterprise-style stage conversion. A long-cycle enterprise business that ignores cycle length is flying blind.
Pipeline review cadence
Cadence is what turns pipeline data into pipeline action.
Weekly. A 30-minute pipeline gen review with sales and RevOps. Three questions: what did we add this week, what slipped, what is at risk. No deal-by-deal walking unless a number is at risk.
Bi-weekly. A 60-minute deal review on top deals only. Top 10 by value or top deals by stage gate. Multithreading, decision criteria, MEDDIC or whatever framework the team uses.
Monthly. A 90-minute funnel review with marketing, sales and RevOps. Source mix, stage conversion, SLA performance, scoring model accuracy. This is where the data drives changes to next month’s mix.
Quarterly. A pipeline health offsite with the leadership team. Trailing-four-quarter conversion, cohort behavior, ICP refinements, hiring plan alignment. The quarterly view catches structural problems that the weekly view misses.
The cadence stays even when the quarter is going well. Pipeline gen is a flywheel and flywheels need maintenance even when they are spinning fast.
Common mistakes that quietly kill pipeline
The same five mistakes show up in almost every diagnosis we have run with revenue teams.
Mistake 1: chasing volume over quality. Pushing SDRs to 100 dials a day on lists that were not refreshed in six months. Volume metrics look great in the SDR weekly. Sales-accepted rates collapse. The number does not move.
Mistake 2: handoff chaos. Marketing throws leads to sales without context. Sales rejects them or lets them age. The argument repeats in every QBR. Nobody fixes the SLA because everybody thinks the other team is the problem.
Mistake 3: no source attribution. Every opportunity is “self-sourced” because that is the default in the CRM. Three quarters later, leadership has no idea which channel deserves more budget. Decisions get made on vibes.
Mistake 4: a fuzzy ICP. The team is told to “go after mid-market”. Nobody can name the three industries, the two personas, the company size band, the trigger event. SDRs default to whoever is on the list. Win rates stay below 15 percent.
Mistake 5: no scoring at all, or a scoring model nobody trusts. Either a flat list where every lead is equally hot, or a scoring model that was set up two years ago, never tuned, and now flags people the AEs ignore on principle. Both lead to the same place: sales working on instinct, not on signal.
There are more mistakes than five. These are the ones that show up first.
The pipeline generation stack
A modern stack is leaner than it was five years ago. The old approach stacked seven or eight specialized tools. The new approach consolidates whenever possible.
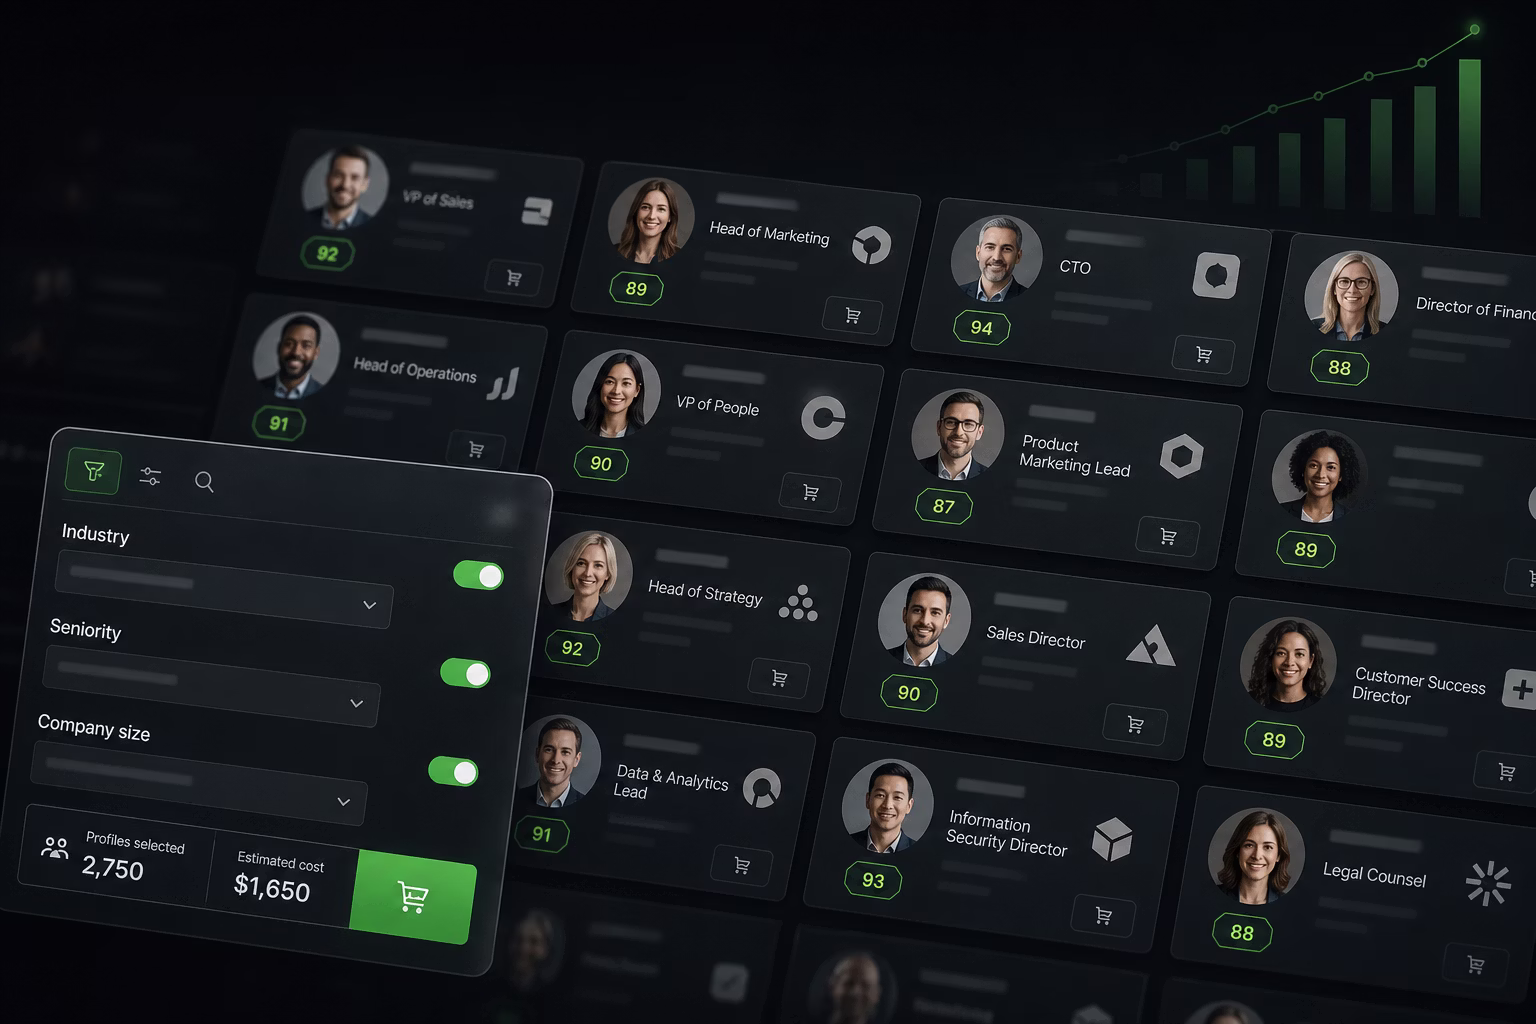
Data layer. A B2B contact database with verified emails and phones, plus enrichment that fills the gaps your CRM has. The lead database layer is where pipeline gen starts: bad data at the top means wasted SDR time at the bottom.
Engagement layer. Multichannel sequences, calling, social, with the orchestration logic baked in. This is where the cold email, cold call, and LinkedIn execution happens.
Scoring and prioritization layer. Fit and intent scoring, real-time alerts, account-level signals. This is what tells the SDR what to work next.
CRM. HubSpot, Salesforce, Pipedrive. The system of record. Every other tool feeds into it bidirectionally or it does not get adopted.
Reporting and analytics layer. Dashboards on coverage, velocity, source mix, conversion stages. Some teams use the CRM’s native reporting. Larger teams add a BI layer.
The trend is consolidation. Sales leaders running pipeline gen in 2026 want fewer logins, cleaner data, and faster onboarding for new reps. The sales leader view of the stack tends to favor platforms that combine database, engagement and scoring rather than wiring three vendors together.
Frequently asked questions
How is pipeline generation different from lead generation?
Lead generation captures contact information from people showing early interest. Pipeline generation creates qualified sales opportunities with stage, amount and close date. A lead is a name. Pipeline is a deal.
What is a healthy pipeline coverage ratio?
3x is the general benchmark for mid-market motions with 60 to 120 day cycles. SMB and product-led teams can run leaner at 2x to 2.5x. Enterprise teams with long cycles need 4x to 5x. The right ratio is the one that historically converts to your number.
How fast should sales respond to an inbound lead?
Under 5 minutes for high-intent signals like demo requests or pricing page activity. Under 1 hour for standard MQLs during business hours. Conversion drops sharply after the first hour and falls off a cliff after 24 hours.
Should SDRs be measured on meetings or opportunities?
Both, with the bonus weighted toward sales-accepted opportunities. Meetings booked is the leading indicator the SDR controls. Sales-accepted opportunities is the lagging indicator the business actually values.
How many channels should a pipeline generation strategy use?
At least three with meaningful contribution. Concentration above 60 percent in any single source is a risk. Most healthy mid-market teams run a mix of inbound, outbound and partnerships, with expansion and events layered in as the company matures.
When should a startup start outbound pipeline generation?
When the founder has closed at least 10 to 20 deals through founder-led selling and can articulate the ICP, the trigger event, and the value proposition in one sentence each. Before that, outbound burns money and obscures the signal that founder-led selling provides.
Closing thought
Pipeline generation is not a tactic. It is the operating system of a modern revenue org. The teams that thrive in 2026 treat it that way: a defined set of sources, a clear scoring and handoff model, a metrics dashboard everyone reads, a cadence everyone respects, and a tool stack that supports rather than obstructs.
The teams that struggle treat pipeline gen as something that “just happens” when sales and marketing both do their jobs. It does not just happen. It is built, measured, debugged, and rebuilt every quarter.
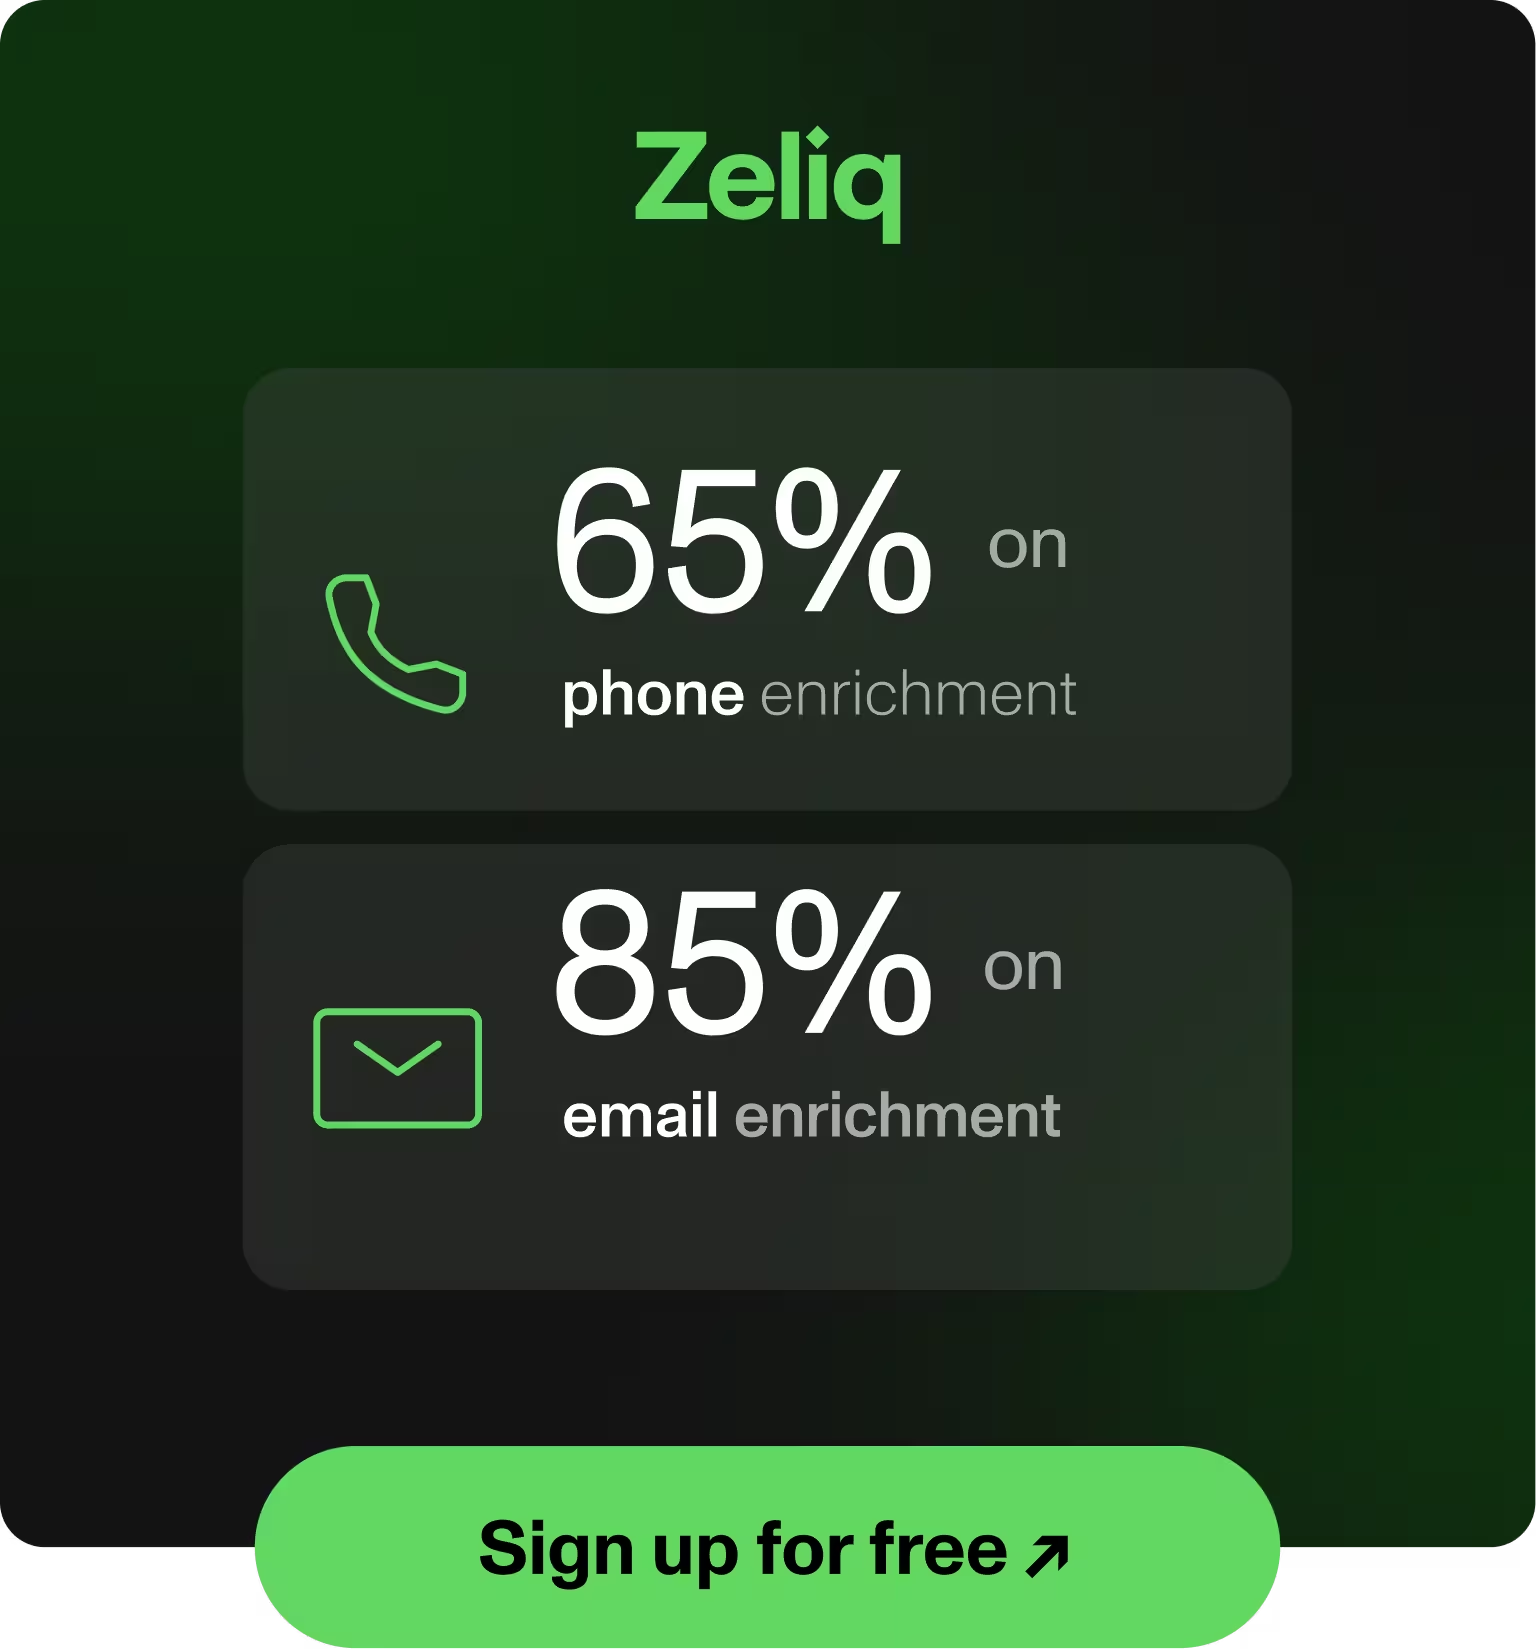
Ready to build a pipeline gen motion that actually compounds? See how Zeliq combines lead database, multichannel engagement and scoring in one place by checking the pricing and starting a workspace today.
Enter the future of lead gen
.webp)