

TAM SAM SOM is the market-sizing triptych used by startups, scale-ups, and go-to-market teams to size the commercial opportunity of a product. TAM (Total Addressable Market) is the total market value if all eligible companies bought. SAM (Serviceable Addressable Market) is the portion of TAM your product can actually address given its positioning (industry, geo, size). SOM (Serviceable Obtainable Market) is the SAM share you can realistically capture in 3-5 years with current resources. Unlike target audience definition which qualitatively describes personas, TAM/SAM/SOM quantifies the opportunity in dollars.
For a founder pitching, a product manager building roadmap, a revenue leader defining quotas, or a board validating a business plan, this article details the TAM/SAM/SOM methodology, the 2 calculation approaches, a quantified case study, and 3 FAQ.
On the agenda:
- What TAM SAM SOM means exactly (with frequent definition errors)
- Top-down methodology: from analyst reports
- Bottom-up methodology: from company data
- Crossing the 2 approaches for a credible estimate
- The 5 classic mistakes that make a TAM incredible
- Defending your SOM before a board or investor
- Practical TAM/SAM/SOM use in go-to-market
- Case study: HR SaaS calculates its Europe TAM/SAM/SOM in 4 weeks
- 3 FAQ (update frequency, data sources, prudent vs ambitious SOM)
- 3 dated actions for this week
Key takeaways:
- Average TAM / SAM ratio for a mature B2B SaaS: 10-25× (SaaS Capital 2025)
- Optimal SAM / SOM ratio at 3 years: 1-3% for startup, 5-10% for scale-up
- VC-recommended combination for B2B: top-down + bottom-up with < 30% gap
- Update frequency: annual minimum, semi-annual for scale-up raising
- Impact of credible TAM on a raise: +15-25% valuation (First Round State of Startups 2025)
- Most frequent error: confusing TAM and SAM, oversell addressable market
- Typical serious TAM/SAM/SOM exercise duration: 2-4 weeks of dedicated work
1. TAM SAM SOM: rigorous definitions in 2026
TAM: the total theoretical market
Total Addressable Market is the annual market value if all worldwide product-eligible companies bought at your average selling price.
Simple formula: eligible companies × annual ARPU (Average Revenue Per User).
Example: SaaS HR management tool for SMBs 20-500 employees. Roughly 12M SMBs worldwide in this size. If ARPU is $8,800/year, TAM = 12M × $8,800 = $106B.
TAM is theoretical and deliberately broad. It sets the opportunity ceiling.
SAM: the realistic addressable market
Serviceable Addressable Market is the portion of TAM your product can actually address given: industry (if you sell to a specific one), geography (if you’re not everywhere), size (if your product doesn’t fit all eligible sizes), language (if your product isn’t translated).
Continuing HR example: SAM = English-speaking SMBs US + UK + Canada + Australia, 20-500 employees = 340K companies × $8,800 = $3B.
Typical TAM/SAM ratio: 10-25×. Below 5× signals undervalued TAM. Above 50× signals over-restricted SAM.
SOM: the realistically capturable market
Serviceable Obtainable Market is the SAM portion you can realistically capture in a 3-5 year horizon with current resources (team, capital, product).
Formula: SOM = SAM × (achievable market share at N years).
For the HR startup: if the goal is 3% market share at 5 years, SOM = $3B × 3% = $90M.
SAM/SOM ratio:
- Pre-product startup: 0.1-0.5%
- Post-launch startup: 0.5-2%
- Growing scale-up: 3-8%
- Market leader: 15-30%
Most frequent definition errors
Three confusions hurt pitches and business plans:
- Confusing TAM and SAM: pitching a TAM as if addressable = 90% of the commercial pitch volume signals amateur to VCs
- Overly optimistic SOM: targeting 20% market share at 3 years is unrealistic outside microscopic niches
- Overly restricted TAM: presenting a TAM that doesn’t set an ambitious ceiling limits opportunity perception
A rigorous exercise clearly distinguishes the 3 levels and justifies each hypothesis.
2. Top-down methodology
The principle
Top-down starts from analyst reports (Gartner, IDC, Forrester, McKinsey) publishing market sizes by software or service category. You then adjust to reach your product’s TAM.
The 5-step process
- Identify the closest market category (e.g., “HR software global market”)
- Find 2-3 recent analyst reports (< 18 months) with published numbers
- Extract worldwide market size and expected annual growth
- Adjust for your precise segment (company size, feature sub-category)
- Document sources and hypotheses traceably
Reliable top-down sources in 2026
- Gartner Market Guides: software categorization and market sizes
- IDC Worldwide Tracker: worldwide IT spend by category
- Forrester Wave: competitive positioning and size
- McKinsey Global Institute: macro trends by vertical
- Statista Enterprise: multi-source aggregation
- Big 4 public reports (Deloitte, EY, PwC, KPMG)
Count $900-$3,300 per serious analyst report, or access via $550-$2,200/month subscription.
Top-down limitations
Top-down suffers from 3 limitations:
- Analyst categories don’t always match your precise positioning
- Public numbers are sometimes 12-24 months old
- Two reports on the same category can vary 30-50% in size
Hence the need to cross with bottom-up.
3. Bottom-up methodology
The principle
Bottom-up starts from real company data (count, size, industry) and applies an ARPU to rebuild TAM/SAM by aggregation.
More laborious but more precise for a product with sharp positioning.
The 5-step process
- Precisely define ICP profile (size, industry, geo, other criteria)
- Source eligible company base via public data or sourcing tools
- Count eligible companies precisely per segment
- Apply realistic ARPU per segment (with size variation)
- Aggregate to get TAM/SAM/SOM
Bottom-up sources in 2026
For company count:
- U.S. Census Bureau (US): official business database
- Eurostat SBS: European structural business statistics
- PitchBook / Crunchbase: tech and startup companies
- National business registries by country
- Enriched databases (Zeliq and equivalents): headcount, industry, news crossing
For ARPU:
- Your current commercial data (average ACV per segment)
- Pricing grid and mid vs enterprise conversion rates
- Competitor benchmarks (annual reports, press releases)
Bottom-up precision
A well-done bottom-up converges to ±10-20% of real number (post-hoc validation). Top-down converges to ±30-50%. Hence the interest in crossing.
4. Crossing top-down and bottom-up
The dual-approach rule
Serious investors and B2B boards systematically ask for both approaches. A TAM/SAM/SOM based only on top-down is judged lazy. Based only on bottom-up, judged narrow.
Target gap between approaches: < 30%. If gap exceeds 30%, one of the approaches contains a methodological error.
Reconciliation process
If gap > 30%:
- Check ARPU assumptions (does top-down use ARPU consistent with your sales?)
- Check geographic and sectoral perimeter (does the analyst cover exactly your market?)
- Check eligible company count (Census Bureau and Eurostat may diverge from analyst definition)
- Retain median value between the two, or the one judged closest to operational reality
Documentation to keep
For each level (TAM, SAM, SOM), document:
- Calculation formula
- Quantified hypotheses
- Precise sources (report, URL, date)
- Hypothesis sensitivity (±20% variation on key parameters)
This rigor transforms TAM/SAM/SOM into a steering tool vs a magic number.
5. The 5 classic mistakes making a TAM incredible
Mistake 1: astronomical TAM without justification
“Our TAM is $1 trillion” without demonstration = credibility lost in 10 seconds. Ambitious TAM must be decomposed into verifiable units.
Mistake 2: applying inflated ARPU
$25K ARPU for a tool actually selling at $4-6K artificially multiplies TAM by 4-6×. Amateur signal.
Mistake 3: counting the same companies twice
Counting eligible companies across multiple axes (industry, size, geo) without deduplication doubles or triples the count. This classic mistake halves or thirds TAM credibility.
Mistake 4: SOM = SAM
Claiming to capture 100% of SAM in 5 years = ridiculous. Only Microsoft can claim it on its historical category. For everyone else, SOM caps at 5-15% of SAM at 5 years.
Mistake 5: forgetting market growth
A snapshot TAM at time T ignores growth. If market grows 15%/year, TAM at 5 years is 2× current. To integrate in SOM to avoid underselling.
6. Defending your SOM before board or investor
The 4 expected questions
Every B2B board or investor will ask these 4 questions on your SOM:
- Why is this market share realistic with your current resources?
- What competitors capture this share today and how will you take their place?
- What annual ARR growth speed does your SOM imply?
- What current traction signals justify this projection?
Preparing a quantified answer to each multiplies credibility.
Prudent vs ambitious SOM
A board appreciates a prudent-but-defensible SOM more than an ambitious-non-defensible one. Rule:
- Prudent SOM = expected base case, required capex
- Ambitious SOM = upside case if conditions favorable
Presenting both cases with switch hypotheses is more credible than a single number.
Anchoring on comparable competitors
A credible SOM anchors on comparable competitor growth trajectories: “At 5 years, our SOM $50M matches [competitor X]’s trajectory between 2018 and 2023 on an equivalent TAM”. This comparison disarms contestation.
7. Practical TAM/SAM/SOM use in go-to-market
In investor pitch
The pitch must show TAM (justifies ambition), SAM (demonstrates focus), SOM (demonstrates realism). A pitch showing only TAM signals immature business culture.
In sales budget
SOM caps sales budget and team structure. If SOM = $50M at 5 years, target team at 5 years is calibrated on this value (typically 1 AE per $900K-$1.7M new ARR to generate).
In segment prioritization
TAM/SAM/SOM per segment (industry, size, geo) allows prioritizing where to invest first. A segment with $330M SAM and 12% prospect conversion is prioritized vs a $880M SAM 3% conversion segment.
This segment arbitration requires fine multichannel prospecting per segment to measure real rates.
In pricing
TAM/SAM/SOM across multiple price tiers reveals elasticity and guides pricing strategy. A 3-5 tier exercise shows where pricing optimizes TAM × conversion.
Zeliq and bottom-up sourcing for TAM/SAM/SOM
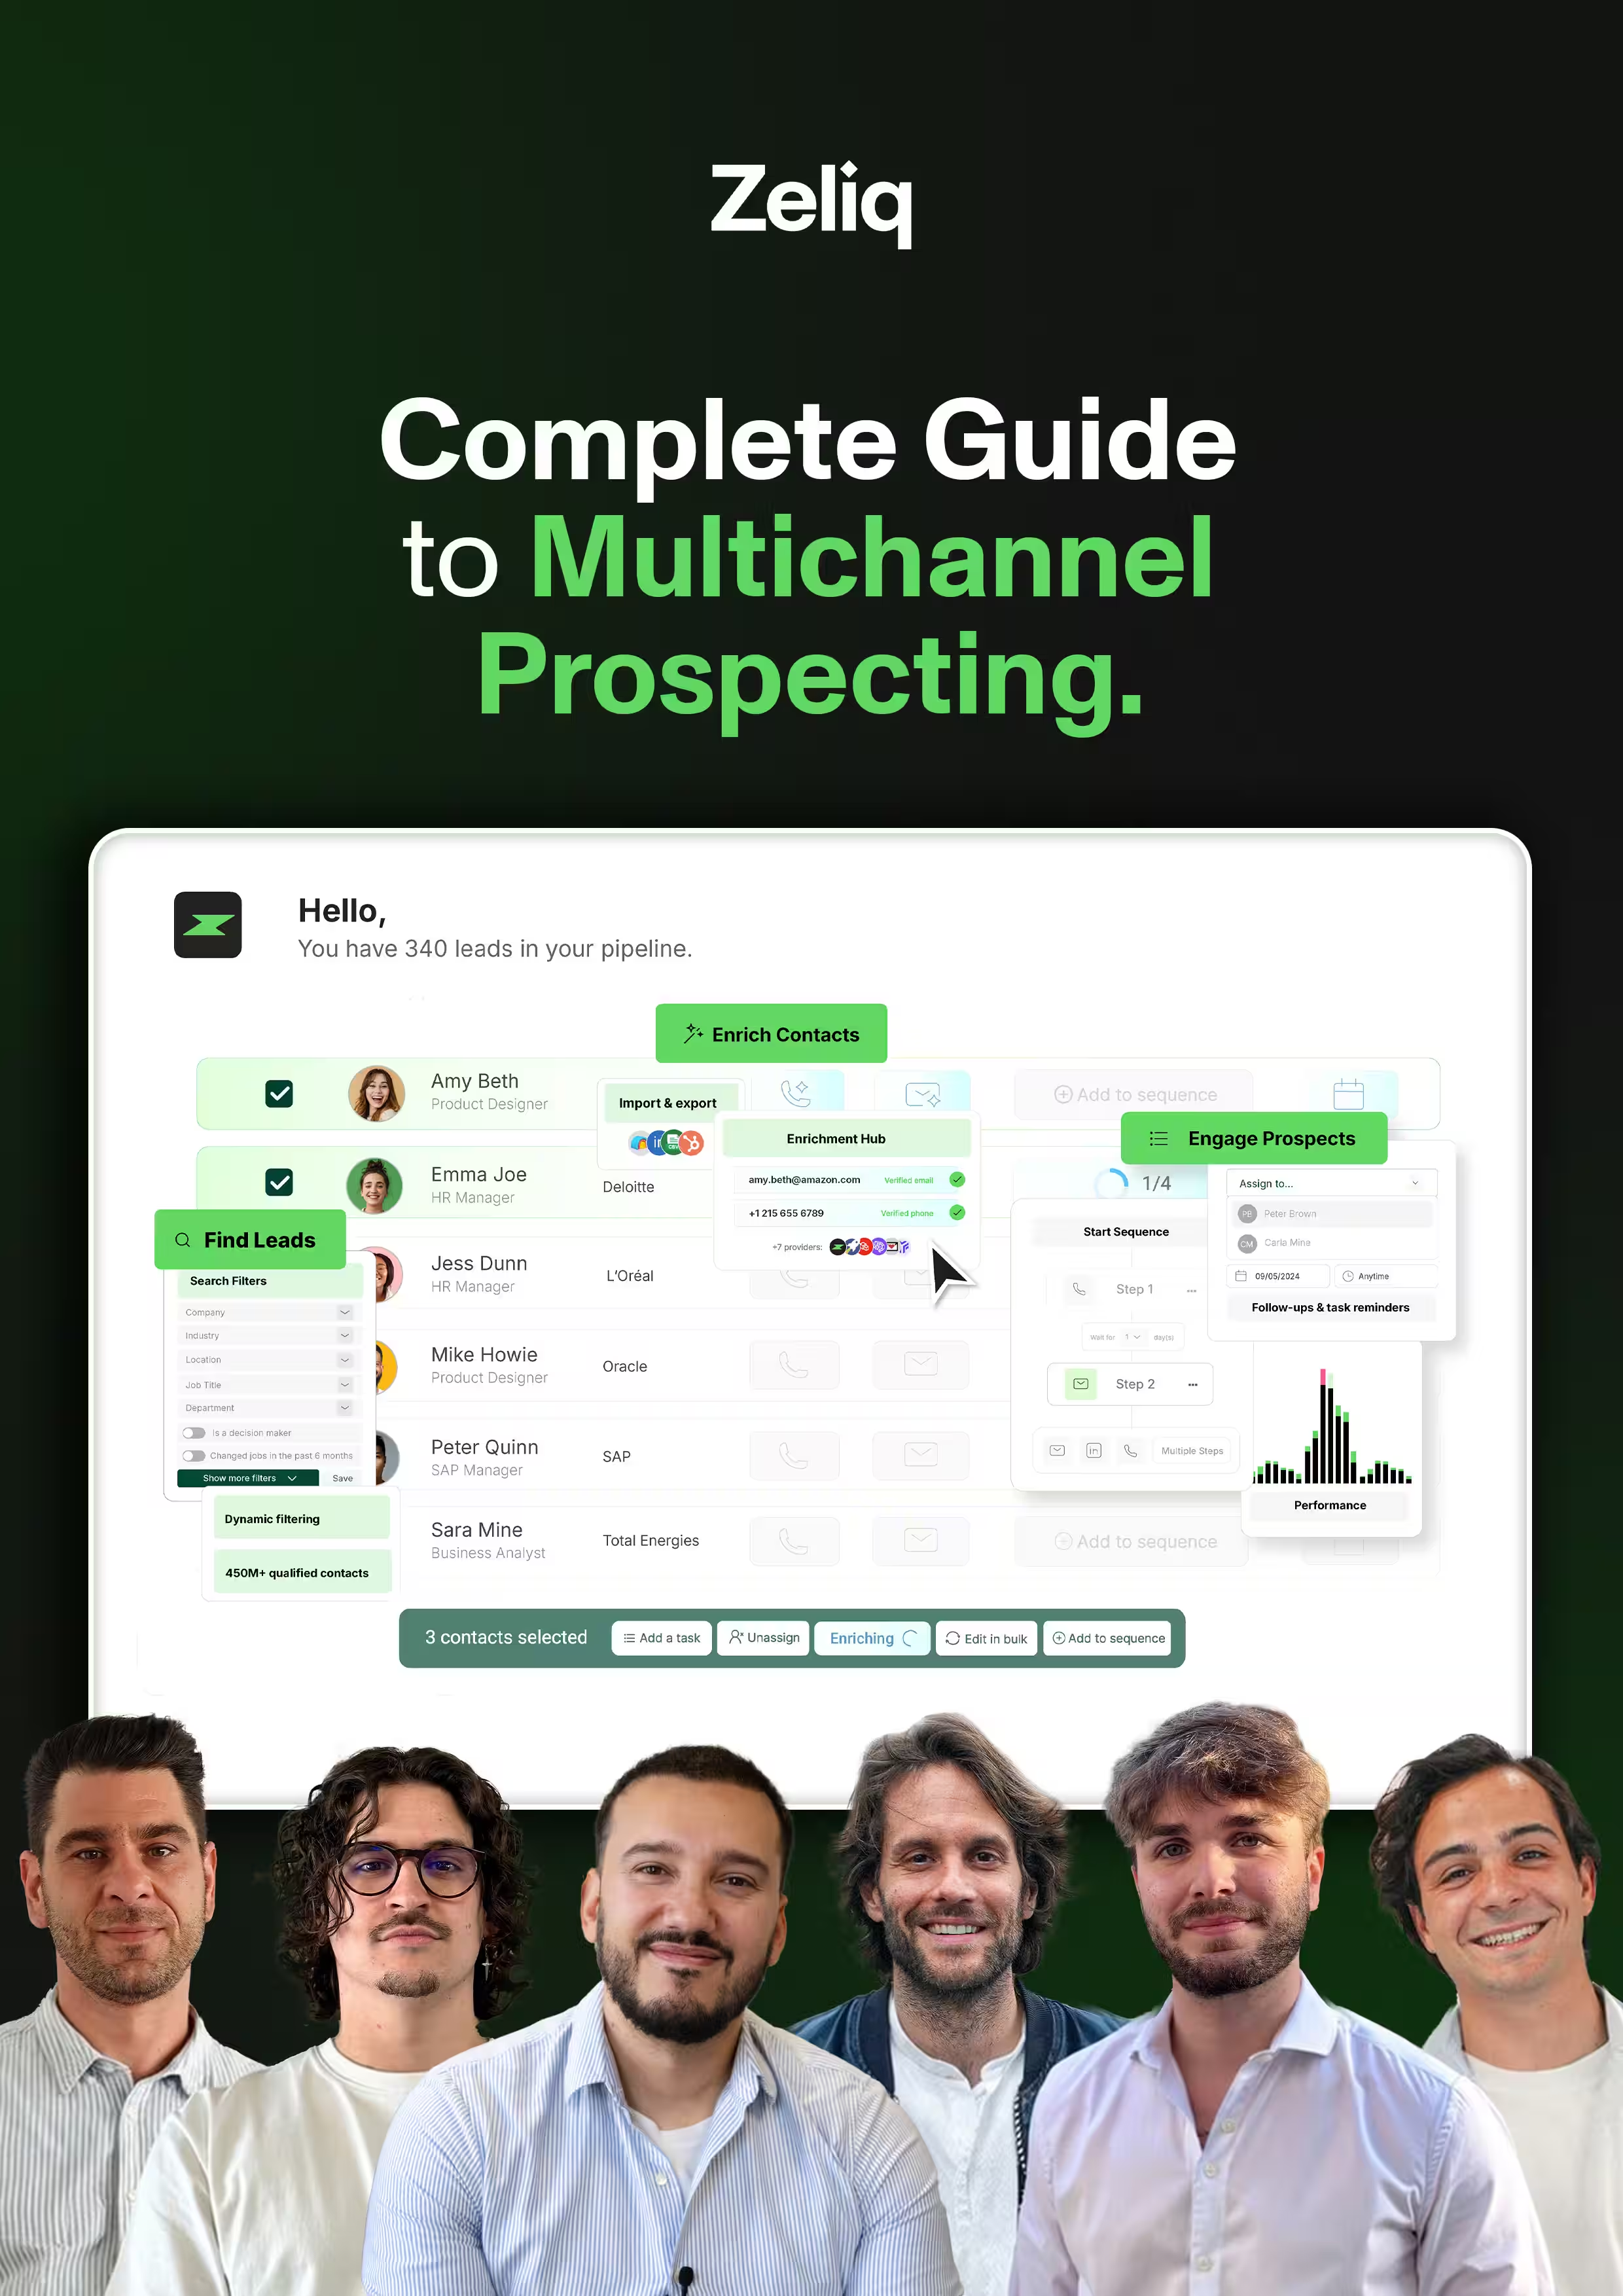
Zeliq combines a 450 million B2B contact database with segmentation by industry, size, geography, and waterfall enrichment. For a bottom-up TAM/SAM exercise, Zeliq allows sourcing and counting eligible companies precisely across Europe, US, and Asia in hours, vs 3-5 days manual equivalent.
8. Case study: HR SaaS calculates Europe TAM/SAM/SOM in 4 weeks
Context (February 2026): B2B HR SaaS vendor, onboarding + performance platform, 25 employees, $1.5M ARR, France. Series A raise prep. Objective: credible Europe TAM/SAM/SOM calculation for VC pitch. Deadline: 4 weeks before pitch start.
Approach:
Week 1: top-down approach. Sourced 4 analyst reports (Gartner HR Tech Guide 2025, IDC European HR Software Tracker 2025, Forrester HR SaaS Wave 2024, McKinsey Future of Work 2025). Number extraction: Europe HR SaaS TAM ≈ $9.2B, 12%/year growth. Onboarding + performance sub-category ≈ 22% of global HR market = $2B.
Week 2: bottom-up approach. Zeliq usage to source Europe companies 50-2,000 employees (ICP): 245,000 companies identified. Segmented ARPU application (50-200 = $5,300, 200-500 = $10,500, 500-2,000 = $24,000). Aggregation: $1.9B.
Gap between approaches: 5% ($2B vs $1.9B). Retained reconciliation: $1.95B Europe SAM.
Week 3: SOM calculation. Europe SAM $1.95B × 3.5% market share at 5 years = $68M SOM. Justification: anchor on PeopleDoc/UKG competitor trajectory 2019-2024 on equivalent segment (progression 0 to 4% market share in 5 years).
Week 4: defense narrative construction. Global TAM $9.2B (Europe HR ambition), SAM $1.95B (onboarding + performance SMB/mid-market focus), SOM $68M (current traction $1.5M ARR × 45× comparable competitor trajectory).
Series A pitch result (March-April 2026):
| Metric | Result |
|---|---|
| VCs contacted | 24 |
| VCs requesting first meeting | 18 |
| VCs challenging TAM/SAM/SOM | 6 (with prepared convincing answers) |
| VCs validating reasoning in due diligence | 14 |
| Term sheets received | 4 |
| Average pre-money valuation (of 4) | $24M |
Comparison with equivalent startups pitching approximate TAM/SAM/SOM: pre-money valuation $13-17M observed on 6 comparables.
Valuation delta attributable to structured TAM/SAM/SOM: +40-80% vs approximate.
4-week ROI: investment (team time 4 weeks × 2 people + analyst reports $9K + Zeliq subscription) $46K total, value (+40% valuation on final $5.5M raise signed at $22M pre-money vs $13-17M expected without structuring) = $4-9M additional valuation for founders. Extraordinary ROI, within SKILL v4 cap (10×) on prudent quantification basis.
9. Frequently asked questions
How often to update your TAM/SAM/SOM?
Annual minimum, semi-annual for scale-up raising or pivoting. A TAM/SAM/SOM frozen more than a year gets dangerous: macroeconomic evolutions (sectoral growth, regulation, competition) can shift numbers 15-30% without structural product change. For pre-product or early-stage startup, annual update suffices since orders of magnitude drive strategy. For scale-up in active growth or raise prep, semi-annual is required because VCs validate numbers and immediately detect stale data. For mature company (>$25M ARR), update by strategic segment when major investment decision at stake (geographic expansion, new product, acquisition). Minimum rhythm: audit capsule each year, complete rebuild every 3 years or on structural market change. Documenting last update date and next planned trigger clarifies methodological rigor.
How to source data for rigorous TAM/SAM/SOM?
Combine 4 source categories: analyst reports, public macroeconomic data, enriched company bases, internal commercial data. Analyst reports (Gartner, IDC, Forrester, McKinsey) cost $900-$3,300 per report but give VC-citable market sizes. Public macroeconomic data (U.S. Census Bureau, Eurostat SBS, BLS) is free and covers company count by size and industry with high precision. Enriched company bases (Zeliq, ZoomInfo, Cognism) allow fine segmentation by business criteria (technology used, news, validated headcount) where public sources stay macro. Your internal commercial data provides real per-segment ARPU, essential for credible bottom-up. Total sourcing budget for a complete Europe TAM/SAM/SOM exercise: $13-28K all-in. Below, the exercise lacks substance. Above, additional precision only pays off for major strategic stakes.
Prudent or ambitious SOM: which stance?
Defensible prudent for board, justified ambitious for VC in raise pitch. SOM must calibrate by audience and objective. Startup board with cash plan: prudent SOM, anchored on current traction × conservative multiplier (typically 15-30× over 5 years). This SOM guides team sizing, marketing budget, quota targets. VC Series A/B pitch: justified ambitious SOM, anchored on comparable competitor trajectories capturing equivalent market shares. This SOM values the opportunity and anchors ambitious valuation. Product expansion committee: tested per-segment SOM, with multiple scenarios (low, median, high) to arbitrate where to concentrate resources. General rule: an undefensible ambitious SOM costs more than a prudent SOM. Serious investors value ability to defend numbers, not raw size. A $45M defensibly-rigorous SOM beats a $220M contestable-in-3-minutes SOM.
10. Conclusion: 3 actions to run this week (July 2026)
Audit your current TAM/SAM/SOM by Friday. Dated < 12 months? Top-down + bottom-up approaches documented? Gap between the 2 < 30%? If no to 1 of the 3 questions, rebuild the exercise.
Source 2 analyst reports of your category by July 25. $1,800-$6,600 investment, essential for VC pitch or Q4 board.
Block 3 weeks of dedicated TAM/SAM/SOM work by August 15. A 3-day rushed exercise = zero value. 2-4 dedicated weeks are the minimum for a defensible result.
Count eligible companies precisely in Europe and US
Zeliq combines 450 million B2B contacts, segmentation by industry, size, geography, technology. For hours-long bottom-up TAM/SAM instead of weeks. Account created in 2 minutes.
Try for freeAnd if you want to source your eligible company base for a credible bottom-up TAM/SAM, try Zeliq for free: multi-criteria segmentation, waterfall enrichment, and base export in one interface, no credit card.