
Cost Per Lead B2B: 2026 Benchmarks, Formula, and 10 Levers to Lower It
Most B2B teams quote a cost per lead figure with the confidence of someone who has read it on a slide, then realize, when the CFO asks how it was built, that the math is wobbly. CPL is one of the most discussed and one of the most misused metrics in B2B marketing. It looks simple (total spend divided by leads) but everything around the number matters more than the number itself.
This guide gives you a working definition of cost per lead in B2B, the formula and its variants, the 2026 benchmarks by channel and industry, and ten levers to bring your CPL down without trashing pipeline quality. For marketing leaders, growth, RevOps, and founders who need a number their board will not tear apart.
What is cost per lead (CPL) in B2B
Cost per lead is the average amount you spend to acquire one lead during a given period and through a given channel. The basic formula is:
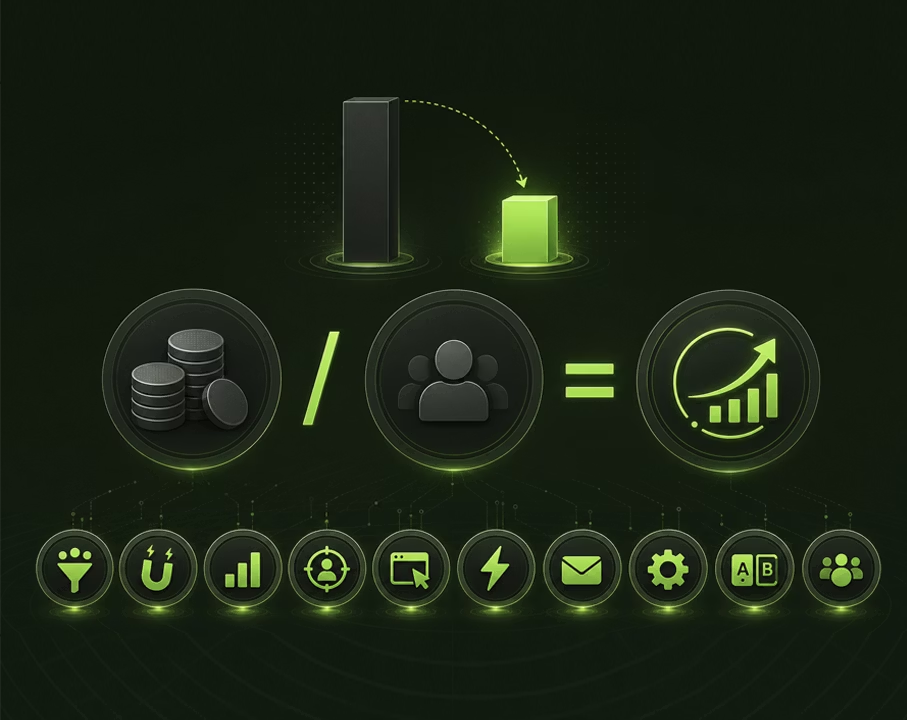
CPL = Total spend on the channel or campaign / Number of leads generated
A “lead” means a contact who has expressed enough interest to land in your CRM: form fill, content download, webinar registration, demo request, free trial signup, meeting booked through outbound. Anonymous traffic does not count. Newsletter subscribers usually do not either, unless they fit a tight ICP filter.
CPL is a channel efficiency metric. It tells you how cheap or expensive it is to fill the top of the funnel with a specific tactic. It does not tell you anything about the quality of those leads, the conversion to opportunity, or the revenue you will book downstream.
CPL vs CPA vs CAC
These three acronyms get mixed up daily. They measure different things and you need to use them together, not interchangeably.
| Metric | What it measures | Denominator | Typical owner |
|---|---|---|---|
| CPL | Cost to get a lead into the CRM | Leads | Demand gen, marketing |
| CPA | Cost to get a defined action (signup, MQL, opp) | Specific action | Performance marketing |
| CAC | Cost to get a paying customer | Closed-won customers | Marketing + sales |
CPA is a more general term: it can mean cost per MQL, signup, opportunity, or demo booked. CPL is one specific flavor of CPA where the action is “a lead in the CRM”.
CAC sits at the bottom of the funnel and includes sales costs (SDR salaries, commissions, sales tooling) on top of marketing costs. A CPL of 80 dollars might translate into a CAC of 4,000 dollars once you factor in SDR time, AE time, and a 4% MQL-to-customer conversion rate. CPL and CAC are not the same number, not even close.
Why CPL still matters in B2B
A few years ago some growth marketers tried to retire CPL on the grounds that it is too shallow. They were half right. CPL as a vanity number, decoupled from quality, is useless. CPL as part of a stack of metrics earns its place on the dashboard.
Efficiency comparison across channels. When you run LinkedIn Ads, content syndication, SEO, outbound, and a partner program in parallel, CPL is the first lens to compare them.
Budget allocation. Quarterly planning asks one question: where does the next 100,000 dollars go? CPL by channel, weighted by close rate and ACV, points to the answer.
Board and CFO reporting. Finance leaders want unit economics. CPL feeds the CAC calculation, which feeds the LTV/CAC ratio and the CAC payback period. Those decide whether you raise the next round or hire the next AE.
Campaign post-mortem. “We got 240 leads” means nothing on its own. “We got 240 leads at 92 dollars CPL versus our 140 dollar channel average” is a decision.
The formula and its variants
The headline formula above (spend / leads) is what most teams ship to the board. In practice you want three variants depending on what you are trying to answer.
Raw CPL
Raw CPL = Total channel spend / Total leads captured
This is your topline number. Include media spend, amortized content production, tooling allocated to the channel, and any agency fees. Do not include salaries unless you do it consistently across all channels.
Raw CPL is good for the dashboard, bad for decisions: it counts every form fill, including the freelancer who downloaded your ebook and will never buy.
MQL CPL
MQL CPL = Total channel spend / Number of marketing qualified leads from that channel
An MQL is a lead that meets your qualification criteria: right title, right company size, right geography, right intent score. MQL CPL is always higher than raw CPL, sometimes 2 to 5 times higher, because many raw leads fail qualification.
This is the number most marketing teams should optimize against. It strips out the junk and reflects the cost of getting someone your sales team actually wants to talk to.
SQL CPL
SQL CPL = Total channel spend / Number of sales qualified leads (or opportunities) from that channel
SQL means the SDR or AE has had a conversation and confirmed the lead is a real fit with a real buying timeline. SQL CPL is the closest CPL gets to revenue truth. In most B2B funnels it is 3 to 10 times higher than raw CPL.
Mature marketing organizations track all three side by side. You report raw CPL to demand gen, MQL CPL to the marketing leadership, and SQL CPL (with close rate and ACV attached) to the CFO.
2026 B2B CPL benchmarks by channel
Benchmarks are useful as guardrails, not as targets. Your number depends on your industry, ACV, geography, and how strictly you define a lead. The ranges below are synthesized from public sources frequently cited in B2B marketing (First Page Sage CPL studies, HubSpot’s State of Marketing reports, Demand Gen Report’s benchmark surveys) and adjusted for the channel mix most B2B teams run in 2026.
| Channel | Typical CPL range (USD) | What drives variance |
|---|---|---|
| SEO and content | 50 to 200 | Domain authority, keyword competition, content production cost |
| Paid search (Google Ads) | 100 to 400 | Bid landscape in your category, landing page CVR |
| LinkedIn Ads | 150 to 400 | Audience targeting precision, creative quality, offer strength |
| Display and programmatic | 100 to 300 | Targeting depth, frequency capping discipline |
| Webinars | 50 to 300 | Promotion mix, speaker pull, registration page CVR |
| Content syndication | 30 to 200 | Vendor quality, audience filter strictness |
| Email marketing | 20 to 100 | List health, segmentation, content fit |
| Outbound (SDR-led) | 30 to 150 | SDR cost loaded in, tooling, list quality, ICP fit |
| Trade shows and events | 200 to 800 | Booth size, sponsorship tier, lead capture process |
| Referral and partner | 40 to 150 | Incentive structure, partner activation rate |
| Organic social | 40 to 180 | Time investment, organic reach, lead magnet quality |
A few patterns worth noting.
Owned channels (SEO, email, organic social) sit at the low end because the marginal cost of an extra lead is close to zero once the asset exists. The catch is the upfront investment and a long time-to-CPL.
Paid channels cluster between 100 and 400 dollars, with LinkedIn Ads consistently more expensive than Google Ads because of CPM. The trade-off: LinkedIn lets you target by title and company with a precision Google cannot match, so MQL CPL is often closer than raw CPL suggests.
Outbound CPL is misleading if you only count tooling. A correct outbound CPL loads the SDR fully (salary, commissions, benefits, tooling, list spend) and divides by qualified meetings. That moves the number from “20 dollars per lead” to a more honest 100 to 200 dollars per qualified meeting.
CPL benchmarks by industry
Industry matters more than channel for one reason: ACV. A higher ACV justifies a higher CPL. The ratio you should care about is CPL to ACV (see next section).
| Industry | Typical raw CPL range (USD) | Notes |
|---|---|---|
| SaaS (SMB-mid market) | 30 to 200 | High volume of trials and content downloads |
| SaaS (enterprise) | 200 to 600 | Smaller TAM, longer sales cycles, gated content |
| Fintech | 100 to 400 | Compliance gates raise content production cost |
| Cybersecurity | 200 to 700 | Long sales cycles, technical buyer scarcity |
| Healthcare and HealthTech | 150 to 500 | Restricted ad platforms, narrow audiences |
| Manufacturing and industrial | 100 to 300 | Niche keywords are cheap but volumes are low |
Your own historical CPL by channel, segmented by ICP tier, beats any external benchmark. Build that dataset before optimizing against averages from a blog post.
The rule of thumb: CPL relative to ACV
The most useful CPL benchmark is internal: how does your CPL compare to your annual contract value?
A common rule of thumb in B2B SaaS is that MQL CPL should sit at or below 1% of ACV. If your ACV is 30,000 dollars, an MQL CPL of 300 dollars is healthy. At 600 dollars MQL CPL you have a problem unless your close rate is exceptional.
The 1% rule is a starting point, not a law. Adjust it based on:
- Close rate from MQL to customer. If you close 5% of MQLs, you can afford 1% of ACV per MQL. If you close 1%, the math breaks.
- Gross margin. Software at 80% gross margin tolerates a higher CPL than services at 40%.
- Payback period target. A 12-month CAC payback constrains you more than a 24-month target.
- Sales cycle length. Longer cycles mean more time for the CAC to weigh on cash flow.
If you do not know your close rate from MQL to customer by channel, that is the first reporting gap to close. Without it, no CPL discussion is rigorous.
If your team spends an hour a day building lists, scraping LinkedIn, and pasting emails into a sequencing tool, your outbound CPL is much higher than the line item on your tooling invoice suggests. Consolidating your stack into one platform (contact data, enrichment, sequences) is one of the fastest ways to cut that hidden cost. See how Zeliq does it for growth marketing teams.
10 levers to reduce your B2B cost per lead
Lowering CPL is rarely a single tactic. It is a stack of small wins compounded over a quarter or two. Here are the ten levers that move the number the most for B2B teams.
1. Narrow your ICP
The fastest way to cut CPL on a paid channel is to stop spending on the wrong people. Tighten your audience filters: precise titles, company size brackets, technographic signals, geography. A clean B2B lead database with strong filtering helps you build the source list right the first time, instead of paying to advertise to people who will never convert. You will see your raw lead volume drop, but your MQL CPL will improve because more of what comes in qualifies. Pair this with negative keywords and exclusion lists. On LinkedIn Ads, exclude job titles you have learned never close. On Google Ads, exclude job-seeker intent (“careers”, “salary”, “review”).
2. Tighten lead scoring before counting
If your CRM counts every form fill as a lead, your CPL looks better than it is and your sales team wastes time on garbage. Implement a scoring model that excludes obvious non-fit (wrong title, wrong country, free email domain, student) at the form stage. The CPL number gets honest, and the team rebuilds trust in marketing-sourced leads.
3. Lift landing page conversion rate
A landing page going from 3% to 6% conversion cuts your CPL by half on the same ad spend. Specific moves that work: cut the form to the absolute minimum fields (3 to 5), match the headline to the ad copy, put social proof above the fold, remove navigation, write the CTA in first person (“Get my benchmark”). Run page speed tests: anything above 3 seconds bleeds conversions.
4. A/B test the ad creative, not just the copy
Most B2B teams test headlines and ignore visuals. In LinkedIn Ads and Meta Ads, visual is the single biggest CTR driver. Run a test with a screenshot of your product against a stock photo against a hand-drawn diagram. CTR differences of 2x are routine, and CTR feeds CPL directly.
5. Shift budget toward higher-intent channels
A LinkedIn Ad reaches someone scrolling. A bottom-of-funnel Google search (“best [your category] software”) catches someone actively buying. Intent shifts CPL: SQL CPL on a high-intent Google query is often 30 to 50% lower than on a LinkedIn Ad, even if raw CPL is similar. Audit your channel mix and rebalance toward intent.
6. Renegotiate ad costs and reduce frequency waste
LinkedIn Ads and Google Ads reward optimization. Reduce frequency caps where you see diminishing returns. Negotiate annual commits with publishers for content syndication and display. Pause low-performing keywords aggressively; pause low-performing audiences after 1,500 impressions, not 15,000.
7. Repurpose content across formats
A webinar that took 40 hours to produce should generate at least 8 derivative pieces: a SlideShare, a recap blog, 3 short videos, 2 LinkedIn carousels, an email nurture sequence. Each derivative has a marginal cost close to zero and a marginal CPL close to zero. The same logic applies to a flagship report: extract every chart, every quote, every data point into its own asset.
8. Optimize the outbound sequence
Outbound CPL is dominated by SDR time. Better sequences (right cadence, right channel mix, right messaging by persona) lift reply rates from 3% to 7% and cut CPL by more than half. Concrete moves: kill any sequence with more than 8 touches, segment sequences by persona instead of running a generic one, A/B test subject lines weekly, integrate LinkedIn voice notes between emails.
If you want a single platform that consolidates contact data, waterfall enrichment, and multichannel sequences, Zeliq’s multichannel prospecting does it without the four-tool tax most outbound teams pay today.
9. Kill channels that do not pay back
A channel that has run for 12 months with an SQL CPL 3x your average is not a problem to fix, it is a budget line to delete. Reallocating that spend to a proven channel often produces a larger lift than any tactical optimization. Discipline matters more than ingenuity in CPL work.
10. Use AI where it actually moves the needle
The honest 2026 take: AI helps most in three places. Personalization at scale (tailored opening lines for outbound at 10,000 prospects a week). Predictive lead scoring (historical close data ranking inbound leads). Operational automation (data enrichment, CRM hygiene, routing). It helps least in creative work, where average AI-generated copy still underperforms human copy and tanks reply rates.
Why CPL alone is a vanity metric
A 25 dollar CPL sounds great until you find out the close rate from those leads is 0.3%. A 250 dollar CPL sounds bad until you find out the close rate is 12% and the ACV is 60,000 dollars. CPL on its own is incomplete.
The full picture requires four numbers tracked side by side:
- CPL (by channel, ideally MQL CPL)
- MQL to SQL conversion rate (by channel)
- SQL to closed-won rate (by channel)
- ACV (by channel)
From these you compute:
- Effective CAC by channel = CPL / (MQL to customer conversion rate)
- LTV/CAC ratio = (ACV x gross margin x average customer lifetime) / CAC
- CAC payback period = CAC / (ACV x gross margin / 12)
A B2B SaaS rule of thumb: target LTV/CAC of 3:1 or better, CAC payback under 18 months. Channels that fail these tests get reduced budget regardless of CPL. This is the kind of cross-funnel visibility that sits naturally inside a revenue operations workflow rather than in a marketing silo.
A worked example. Channel A has a CPL of 80 dollars and converts 1% of leads to customers at an ACV of 8,000 dollars. Effective CAC is 8,000 dollars, which is 1:1 LTV/CAC if customers stay one year. That channel does not work, even though CPL looks fine. Channel B has a CPL of 400 dollars, converts 6% to customers at 25,000 dollar ACV. Effective CAC is 6,667 dollars. With 70% gross margin and a 3-year lifetime, LTV/CAC is 7.9:1. That channel prints money, even though CPL looks scary.
CPL is the start of the conversation, not the end.
AI and CPL in 2026
The biggest CPL shift of the past two years did not come from a new channel. It came from AI changing the cost structure inside existing channels.
AI SDR tooling has compressed outbound CPL for teams that adopted it deliberately. Automated research, draft personalization, sequence orchestration: tasks that took an SDR 90 minutes a day now take 15. The lever is real, but only when paired with strict ICP discipline. Pointed at a wide audience, AI outbound floods inboxes with low-relevance messages and tanks deliverability, which raises true CPL.
Predictive lead scoring is finally usable out of the box. Models trained on your historical CRM data can rank inbound MQLs with enough accuracy to let SDRs work the top 30% and ignore the bottom 30%. Same lead volume, same CPL on paper, but SQL CPL drops because the SDR team focuses where it matters.
Common mistakes when measuring CPL
A few traps that show up repeatedly in audits.
Mixing time periods. Comparing this month’s CPL to last month’s when one ran a webinar and the other did not is not a benchmark. Average over a quarter.
Forgetting attribution leakage. Multi-touch journeys are the norm in B2B. A “LinkedIn Ad lead” probably saw three blog posts and a referral first. Single-touch attribution overstates the last channel and understates everything upstream.
Counting tooling but not labor. Outbound CPL that excludes the loaded SDR cost is fiction. Same for content CPL that excludes writers and SEO specialists.
Using raw CPL where MQL CPL belongs. Raw CPL flatters channels that produce volume regardless of fit. Default to MQL CPL for decisions.
No segmentation by ICP tier. A CPL averaged across mid-market and SMB hides that one segment is profitable and the other is not.
Lower your B2B cost per lead with Zeliq
All-in-one platform: 450M+ contacts, waterfall enrichment, multichannel sequences. One subscription instead of four tools.
Book a demoCost per lead is one number on a dashboard that hides a dozen decisions: which channels you back, how you define a lead, how strictly you score, how honestly you load your costs, and how clearly you connect CPL to revenue. The teams with the best unit economics in B2B in 2026 are not the ones with the lowest CPL. They are the ones who know exactly why their CPL is what it is, what it is worth in pipeline terms, and which lever to pull next.