

Conversion Funnel: B2B Stages, Benchmarks and CRO Tactics in 2026
A conversion funnel is the most useful mental model in B2B revenue. It tells you where prospects come in, where they drop off, and where to push to lift the number coming out the other end. It is a diagnostic tool: every stage has a conversion rate, every rate has a benchmark, and every benchmark has a typical bottleneck and a tactic that fixes it.
This guide walks marketing, growth, sales and founders through the practical version of the funnel that matters in 2026: classic models (AIDA, AARRR, TOFU/MOFU/BOFU), the eight-stage B2B sales funnel, the funnel-versus-flywheel debate, benchmarks, how to map your own funnel, bottleneck diagnosis, and CRO tactics by stage.
What a conversion funnel actually is
A conversion funnel is the sequence of steps a stranger goes through before becoming a paying customer (and ideally an expansion or referral source after that). Each step has a defined trigger, a measurable population, and a conversion rate to the next step. The shape is a funnel because volume drops at every stage, never the other way around.
In practice, three terms get used interchangeably and they should not be:
- Conversion funnel: the marketing and demand-generation view, end to end. Includes anonymous traffic, lead capture, MQL, SQL, opportunity, win, expansion. Used by growth, marketing, and revenue operations.
- Sales pipeline: the CRM-bound subset, from opportunity created to closed-won or closed-lost. Used by sales leaders for forecasting and rep performance.
- Customer journey: the experiential map, focused on what the buyer does, feels, and sees at each stage. Used by product marketing and CX teams to design content and touchpoints.
A funnel is what you measure. A pipeline is what you forecast. A journey is what you design. They overlap, but conflating them produces confused dashboards and worse decisions.
Funnel as a multiplication
Total conversion rate is the product of every stage rate, not the average. If your visit-to-lead rate is 2 percent, lead-to-MQL is 40 percent, MQL-to-SQL is 30 percent, SQL-to-opportunity is 55 percent, and opportunity-to-win is 25 percent, your end-to-end visitor-to-customer rate is 2% x 40% x 30% x 55% x 25% = 0.033 percent. That single multiplication explains why a 30 percent lift on one weak stage outperforms a 5 percent lift on three strong ones.
The classic funnel models you should know
No single model wins. Pick the one that fits your business model, then translate it to whatever the rest of the company already speaks.
AIDA: the original (1898)
Coined by E. St. Elmo Lewis for advertising:
- Attention: get noticed.
- Interest: trigger curiosity.
- Desire: build preference.
- Action: close the sale.
Still useful for ad creative and messaging hierarchies, but built for a single buyer in a single sitting. It does not handle multi-stakeholder B2B deals or post-sale expansion.
AIDA+R: adding retention
A modern variant tacks on Retention (or Satisfaction as AIDAS) to acknowledge that the funnel does not end at signature. Useful as a reminder that ignoring activation and renewal kills LTV.
AARRR: pirate metrics
Created by Dave McClure for product-led startups. Five stages with measurable rates at each:
- Acquisition: visitors arrive.
- Activation: they have a first successful experience (signup, first value moment).
- Retention: they come back.
- Revenue: they pay.
- Referral: they bring others.
AARRR is the right framework for product-led growth (PLG) businesses where the product carries most of the conversion work. It also forces you to look past acquisition, which is the trap most early-stage marketing teams fall into.
TOFU, MOFU, BOFU: the marketing-content framing
Top, middle, bottom of funnel. Less about stages, more about content intent:
- TOFU: awareness. Prospect has a problem, not a solution shortlist. Content: blog posts, SEO guides, podcasts, social.
- MOFU: consideration. Prospect compares approaches. Content: comparison pages, white papers, webinars, case studies, ROI calculators.
- BOFU: decision. Prospect picks a vendor. Content: demos, free trials, pricing pages, customer references, security docs.
This is the model the content team usually owns. Pair it with AARRR or the eight-stage funnel for a complete picture.
The B2B sales funnel: eight stages from visitor to expansion
For sales-led B2B (mid-market, enterprise), the operational funnel has more stages. This is what you should model in your CRM:
- Anonymous visitor: traffic on your site.
- Known lead: an identifier captured (email, LinkedIn account-match, form fill).
- MQL (Marketing Qualified Lead): meets the minimum scoring criteria (ICP fit + intent signal).
- SQL (Sales Qualified Lead): an SDR or AE has confirmed pain, budget, timing, and authority.
- Opportunity: a deal is created in the CRM with a value and a close date.
- Proposal sent: pricing and scope shared.
- Closed-won or Closed-lost.
- Expansion: upsell, cross-sell, or seat growth post-signature.
Stages 1 to 4 are the demand-generation funnel (marketing-owned with sales handoff). Stages 5 to 7 are the sales pipeline (sales-owned, forecasted weekly). Stage 8 is customer success and expansion, which is where most of the LTV actually lives in SaaS.
If your CRM does not separate these stages explicitly, your team is flying with one combined number (“revenue this month”) and cannot diagnose anything.
Funnel vs flywheel: a real debate or a marketing rebrand?
HubSpot popularized the flywheel model around 2018, arguing the funnel was outdated because it treated customers as the output of a one-way process and ignored the gravitational pull of happy users on new acquisition. The flywheel reframes growth as attract, engage, delight, with momentum compounding through referrals, reviews, and word of mouth.
The honest answer in 2026 is that both are right and neither replaces the other:
- The funnel is a measurement framework. You need it to diagnose drop-offs and forecast revenue.
- The flywheel is a strategy framework. It reminds you that every cohort of delighted customers reduces the cost of the next cohort’s acquisition.
Use the funnel to run the business this quarter. Use the flywheel mental model to decide where to invest in customer success, advocacy, and product-led referral mechanics for next year.
B2C vs B2B funnels: three differences that matter
| Dimension | B2C | B2B |
|---|---|---|
| Sales cycle | Hours to days | 30 to 180 days, sometimes longer |
| Decision makers | One | Three to ten (buying committees) |
| Top-of-funnel volume | Very high | Modest (narrow ICP) |
| Personalization | Light segmentation | Deep, account-level |
| Human sales touch | Rare | Usually mandatory above SMB |
| Average order value | Low to medium | High, recurring |
Practical implication: B2B funnels need more middle-funnel stages (nurturing, multi-stakeholder mapping), slower velocity (a “no decision” today is not necessarily a “no” forever), and higher-quality lead scoring because volume alone will not save you when only 1 in 200 visitors fits your ICP.
Full-funnel benchmarks for B2B SaaS in 2026
Use these as directional reference points, not targets. Your numbers will vary by ACV, ICP, geography, and channel mix. The point is to know whether you are roughly aligned with your category or a stage behind.
| Funnel stage | Median rate | Top quartile |
|---|---|---|
| Visit to lead | 1 to 3 percent | 5 to 8 percent |
| Lead to MQL | 30 to 50 percent | 55 to 65 percent |
| MQL to SQL | 25 to 40 percent | 45 to 55 percent |
| SQL to Opportunity | 50 to 60 percent | 65 to 75 percent |
| Opportunity to Win | 20 to 30 percent | 35 to 45 percent |
| Visit to Customer (overall) | 0.05 to 0.5 percent | 0.5 to 1.5 percent |
Two things to read here. First, the biggest absolute volume loss happens between visitor and lead. Second, the biggest relative improvement opportunity for most teams is MQL to SQL, where median performance is the lowest and top quartile is more than double.
How to map your own funnel
Before you fix anything, you need a single source of truth for what each stage means and where it is measured.
1. Define each stage in writing
Document the trigger, the source system, and the owner for every stage. Example:
- MQL: lead score above 60 (marketing automation) AND ICP fit equals true (form submit). Owner: marketing ops. Source: HubSpot.
- SQL: SDR has held a discovery call AND BANT or MEDDPICC threshold met. Owner: SDR manager. Source: CRM stage “SDR Qualified”.
If two people in your company define a stage differently, the funnel leaks through definitional gaps before you even start.
2. Wire up analytics and attribution
Three tools, three jobs: web analytics (GA4, Mixpanel) for visitor-to-lead, marketing automation (HubSpot, Marketo) for lead-to-MQL and nurture, CRM (HubSpot, Salesforce, Pipedrive) for MQL-to-SQL and the sales pipeline.
You also need an attribution model (first touch, last touch, multi-touch, data-driven). First-touch flatters TOFU, last-touch flatters BOFU, multi-touch is closer to reality. Pick one, document it, make sure marketing and sales report off the same one.
3. Standardize CRM stages
The classic mistake: each rep has their own definition of “discovery” or “negotiation”. The fix is a written stage exit criteria sheet, posted in the CRM, that defines exactly what must be true before a deal advances. Plus a weekly pipeline review flagging deals stuck for more than 2x the median duration.
4. Build one funnel dashboard
Per stage: volume, rate to next stage, average time in stage, trend versus last 4 and 12 weeks. One dashboard, weekly review, one owner. Three competing dashboards (marketing, sales, finance) means you have three opinions, not a funnel.
Bottleneck diagnosis: where is the funnel actually leaking?
You diagnose a funnel by comparing each stage rate to the benchmark and to your own past, then triangulating with cohort and channel breakdowns. Three patterns dominate.
Pattern 1: high TOFU, low conversion
Lots of traffic, few leads. Usually one of:
- Wrong intent: ranking on broad informational keywords with no commercial fit.
- Weak CTAs: no clear next step on TOFU pages.
- Misaligned lead magnet: gated content nobody wants enough to give an email for.
Pattern 2: leads stuck in MQL, never SQL
MQL volume looks healthy but SDRs do not touch them or they do not convert. Causes:
- Lead scoring miscalibrated: rewards activity (page views, opens) without ICP fit.
- No SLA between marketing and sales: hot leads cool while waiting for follow-up.
- Generic outreach: same first email for every MQL regardless of entry point.
Pattern 3: opportunities open, deals do not close
Pipeline is full but win rate sits below 20 percent. Causes:
- Shallow discovery: AEs run demos before pain is qualified.
- Single-threaded deals: only one champion, vetoed by a stakeholder no one mapped.
- No close plan: deals drift through quarter ends with no agreed next step.
The diagnostic move is always the same: segment the leak by source, by ICP segment, and by rep. The cause that looks structural at the funnel level is often concentrated in one or two slices.
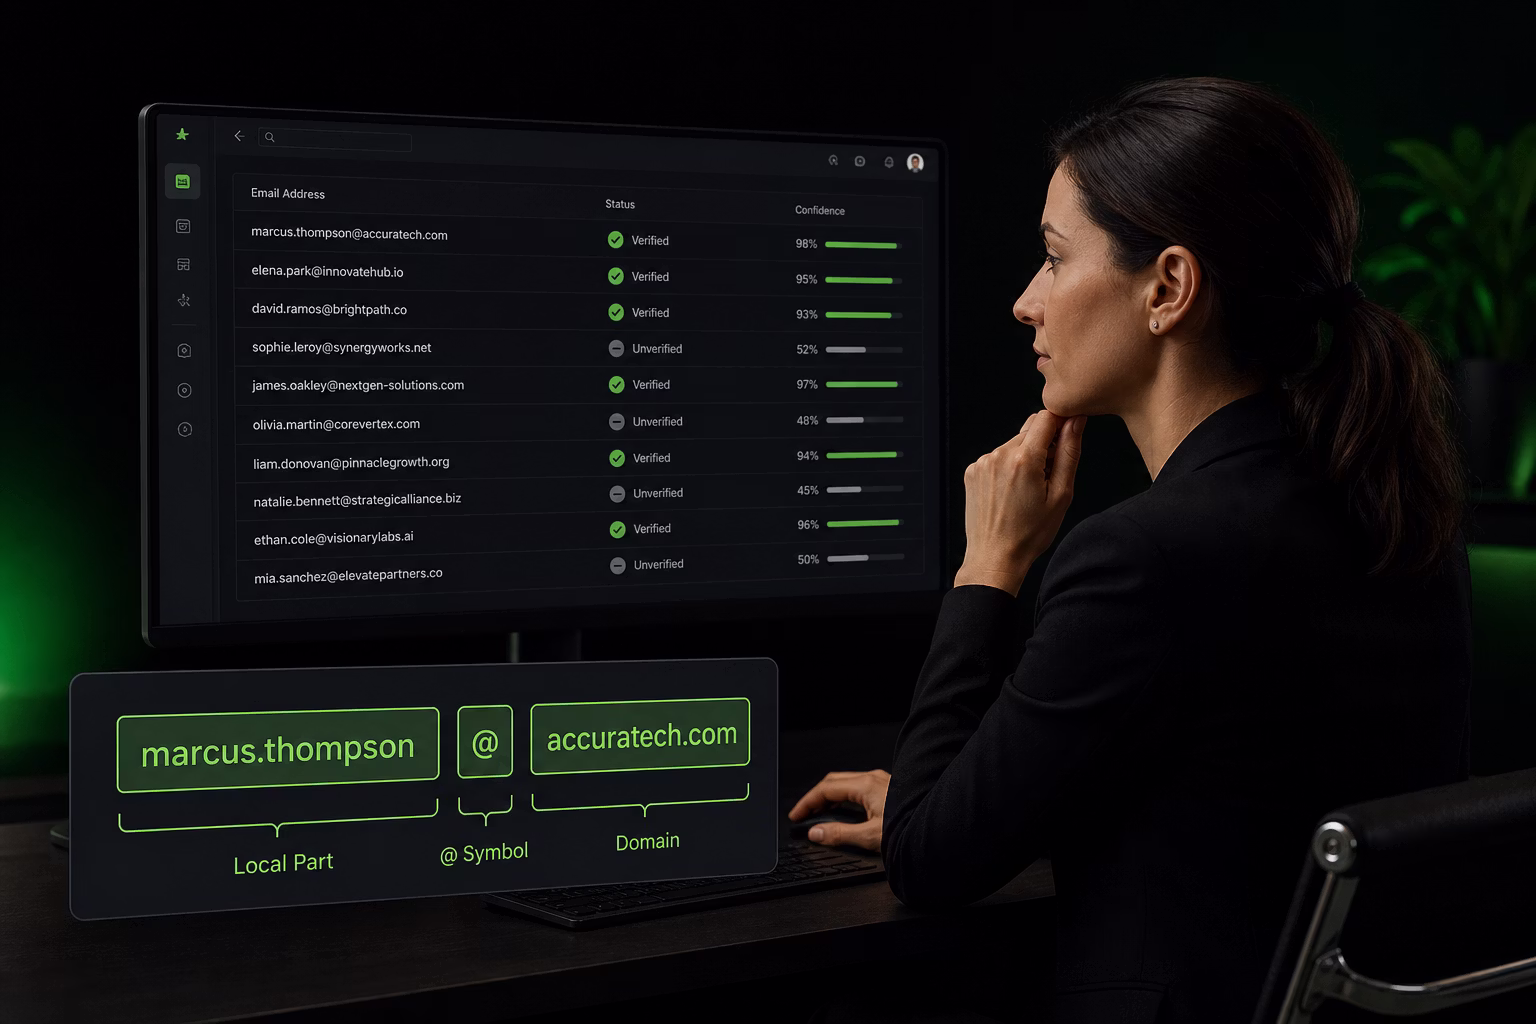
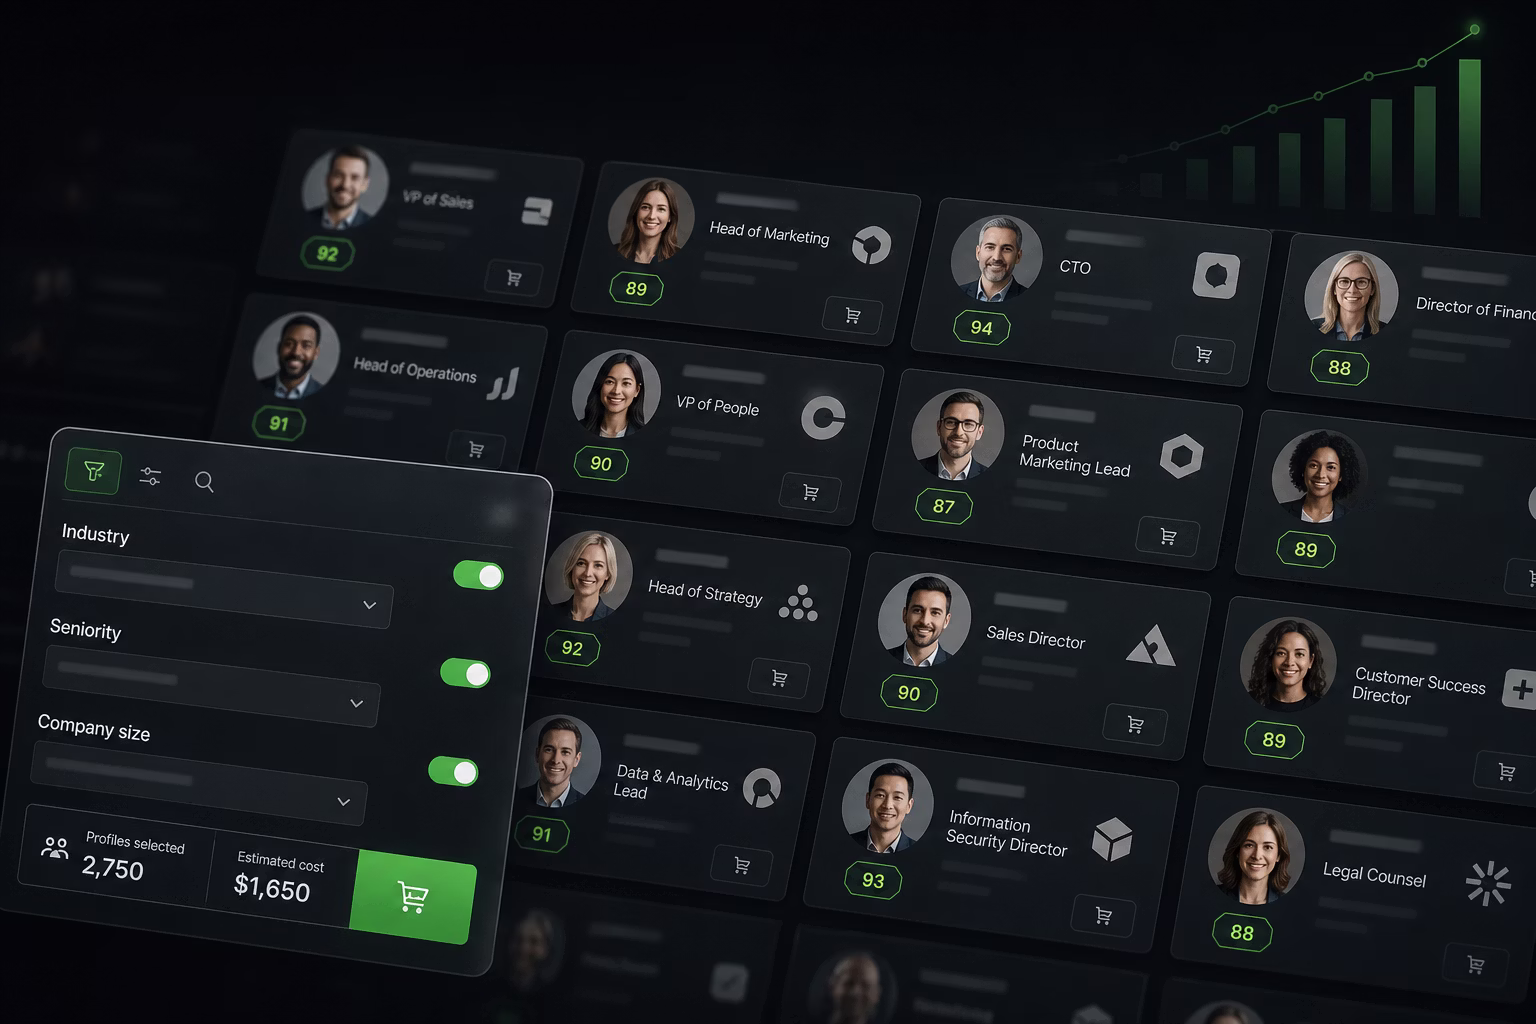
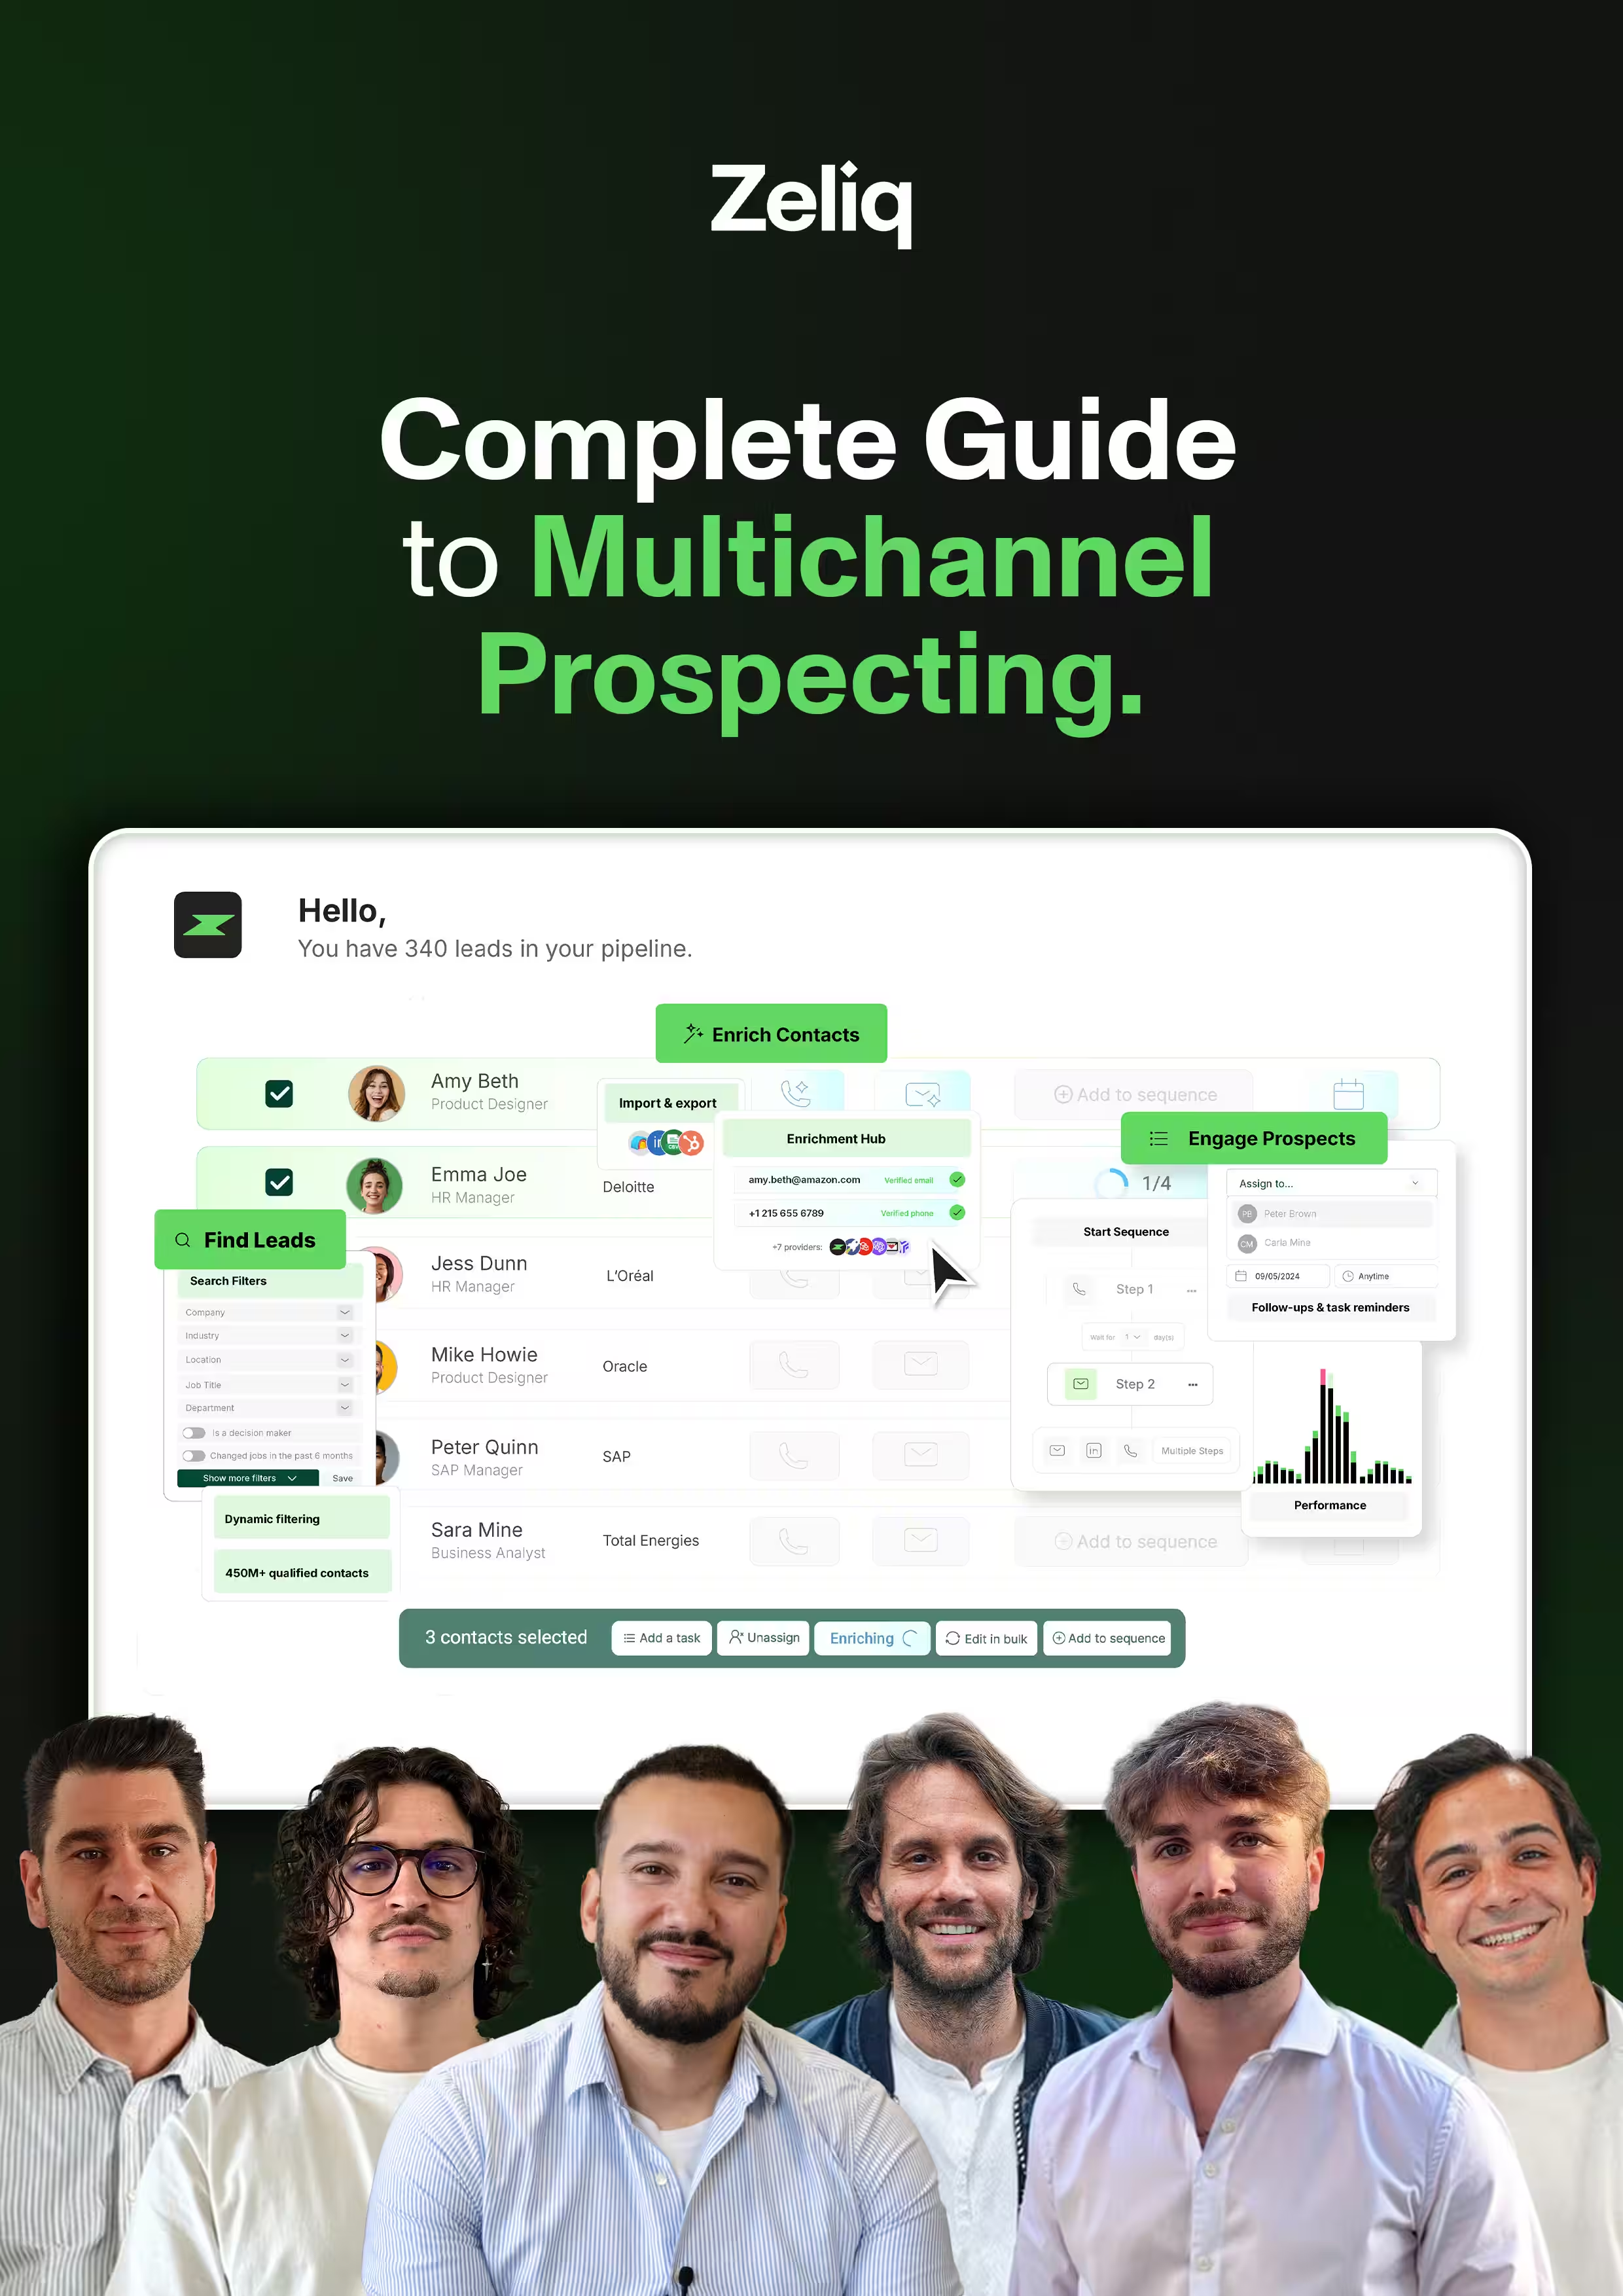
How Zeliq helps you tighten the middle of the funnel
Most funnel leaks live between MQL and Opportunity, where weak prioritization and slow follow-up cost more deals than any TOFU campaign can replace. Zeliq’s lead scoring ranks accounts by engagement signals (opens, clicks, call activity) so reps work the hottest leads first, and multichannel sequences keep email, LinkedIn, and calls coordinated without the manual juggling. See how it fits your stack in a 15-minute walkthrough.
CRO tactics by funnel stage
Conversion rate optimization is the engineering side of the funnel. Each stage has its own playbook.
TOFU tactics: SEO, content, distribution
Goal: increase qualified traffic and convert it into a known lead.
- Topical SEO on commercial intent keywords (“alternative to X”, “best Y for Z”). Build pillar pages plus cluster articles, internally linked.
- Distribution beyond Google: LinkedIn organic from founders and reps, podcasts, niche communities. Zero-click search means more attention is captured outside SERPs.
- Lead magnets that match intent: a benchmark report or template, not a generic “ultimate guide”.
- CTA placement: one above the fold, one mid-article, one at the end. Same anchor each time.
MOFU tactics: lead magnets, case studies, comparison pages
Goal: turn captured leads into MQLs and move them toward sales-ready.
- Mid-funnel content: ROI calculator, customer story with quantified outcome, vendor comparison page (factual, not snide).
- Email nurture: 5 to 7 emails over 2 to 3 weeks, mixing education, social proof, and a soft CTA.
- Lead scoring that combines explicit fit (ICP attributes) and implicit intent (behavior), not just behavior.
- Retargeting on LinkedIn or Google for visitors who consumed mid-funnel content but did not convert.
- SLA: marketing commits to a quality threshold per MQL, sales commits to first touch within 1 hour for hot leads.
BOFU tactics: demo, trial, CTAs that close
Goal: convert SQLs into opportunities and opportunities into wins.
- Demos personalized to the prospect’s stack and ICP, not the canned 30-minute walkthrough.
- Free trial or freemium if your product can demonstrate value within the trial window.
- Customer references from the prospect’s industry or company size, not generic logos.
- Multi-threading: map and engage 3 to 5 stakeholders per deal. Single-threaded deals lose at 2x the rate.
- Mutual close plan: a written sequence of steps and dates from “verbal yes” to “contract signed”.
- Pricing transparency when feasible. Hiding pricing slows BOFU velocity for self-serve segments.
Post-sale: activation, expansion, referral
Often forgotten, this is where SaaS unit economics get fixed.
- Activation: define the “aha moment” and instrument the funnel from signup to that moment.
- Expansion: usage triggers (seat utilization, feature adoption, integration depth) that flag ready-to-expand accounts.
- Referral: in-product invites, partner programs, customer advocacy.
Tools that actually run a B2B funnel
A working stack does not need to be huge, it needs to be coherent.
| Layer | Job | Examples |
|---|---|---|
| Web and product analytics | Visitor and event tracking, activation | GA4, Plausible, Mixpanel, Amplitude |
| Marketing automation | Lead capture, scoring, nurture | HubSpot, Marketo, Customer.io |
| CRM | Pipeline, deal stages, forecasting | HubSpot, Salesforce, Pipedrive |
| Lead database and enrichment | Build target lists with verified contacts | Zeliq lead database, Apollo, Cognism |
| Sales engagement | Multichannel sequences (email, LinkedIn, calls) | Zeliq, Outreach, Salesloft, Lemlist |
| Lead scoring | Prioritize accounts by fit and intent | Native CRM scoring, Zeliq, MadKudu |
| Attribution and reporting | Source-of-truth dashboards | Dreamdata, HockeyStack, native CRM |
Fewer tools beat more tools as long as data flows clean. The gap between MQL and SQL is where most teams overspend on tools and underspend on process.
Quick examples: three funnel snapshots
Example 1: SMB SaaS, PLG with sales assist (~$50 ACV monthly)
- 80,000 monthly visits, 4 percent visit-to-signup (3,200).
- 35 percent activation (1,120 activated), 12 percent activated-to-paid (134 paying).
- 8 percent sales-assisted upsell to mid-tier (11 expansion deals).
Where to push: activation. Lifting it from 35 to 50 percent adds 60 paying customers without any extra traffic.
Example 2: Mid-market B2B, sales-led (~$25k ACV)
- 12,000 monthly visits, 2.5 percent visit-to-lead (300 leads).
- 40 percent lead-to-MQL (120), 30 percent MQL-to-SQL (36), 55 percent SQL-to-Opp (20), 25 percent Opp-to-Win (5 wins per month).
Where to push: MQL to SQL. The score includes too much pure activity and not enough ICP fit, so SDRs burn time on bad leads.
Example 3: Enterprise ABM (~$200k ACV)
- 200 target accounts identified.
- Engaged: 35 percent (70 accounts).
- Active opportunity: 20 percent of engaged (14 opps).
- Opp to win: 30 percent (4 wins per quarter).
Where to push: account engagement. ABM funnels are narrow at the top, so multichannel sequencing and account-level personalization are the highest leverage tactic.
Frequently asked questions
What is the difference between a conversion funnel and a marketing funnel?
In practice, they are the same thing seen from different angles. The marketing funnel emphasizes content and acquisition (TOFU and MOFU). The conversion funnel is the broader end-to-end view from anonymous traffic to paid customer. Marketing and sales should share one diagram with one set of stage definitions even if each team owns different segments.
How is a sales funnel different from a sales pipeline?
The sales funnel describes volumetric drop-off across all stages. The sales pipeline is the operational subset, from “opportunity created” to “closed-won or closed-lost”. You measure conversion rates on the funnel, you forecast revenue and manage rep workload on the pipeline.
How long should a B2B conversion funnel take?
It depends on ACV. Self-serve SMB compresses visit-to-paid into days or weeks. Mid-market runs 30 to 90 days from first touch to close. Enterprise ABM stretches 6 to 18 months. The key metric is velocity by stage, not total cycle: a deal stuck 60 days in negotiation is a different problem from one that took 60 days to leave discovery.
What is a good conversion rate at the top of the funnel?
For B2B, 1 to 3 percent visit-to-lead is typical, with top performers at 5 to 8 percent. The number depends heavily on traffic source: branded organic and direct convert higher than cold paid social. Always segment by source before judging the rate.
Should I use the funnel or the flywheel?
Both. Use the funnel for measurement, diagnosis, and forecasting. Use the flywheel mindset to keep investing in customer success and advocacy, because referrals and reviews compound over time and lower the cost of acquiring the next cohort.
Where do most B2B funnels actually leak?
Two places. Visit to lead loses the largest absolute volume because the rate is structurally low. MQL to SQL is where the biggest relative gain sits, because most teams have lead scoring that overweights activity over fit and a marketing-to-sales handoff with no SLA.
Wrapping up
A conversion funnel is not a slide. It is a measurement system that tells you where your revenue engine is leaking and what to fix next. Pick the model that matches your motion (AARRR for PLG, eight-stage for sales-led, TOFU/MOFU/BOFU for content), define every stage in writing, instrument it across analytics, marketing automation and CRM, and review it weekly with one shared dashboard.
Then resist the urge to optimize what is comfortable. Most teams pour effort into TOFU because it is easier to brief an agency than to fix lead scoring. The biggest gains usually live in the middle, between MQL and SQL, where better prioritization and faster, multichannel follow-up double conversion without adding a single visitor.
If you want a short list of tools and pricing tiers that fit your funnel stage and team size, the Zeliq pricing page lays out plans for growth marketing, sales leaders, and founders who want one platform for find, enrich and engage instead of three.
Enter the future of lead gen
.webp)