
What Is a Good Email Open Rate? Benchmarks, Context, and the Metrics That Actually Matter
If you have spent any time running email outreach campaigns, you have probably asked the same question at some point: “Is my open rate actually good?” It sounds straightforward, but the honest answer is: it depends, and in 2026, it matters less than you think. This guide breaks down what a good email open rate really looks like, why benchmarks are slippery, how Apple Mail Privacy Protection has quietly broken the metric for millions of senders, and why reply rate is now the KPI that serious outreach teams track first.
What Is an Email Open Rate, Exactly?
An email open rate is the percentage of delivered emails that register as “opened.” The calculation looks simple:
Open Rate = (Emails Opened / Emails Delivered) x 100
In practice, an “open” is recorded when a tracking pixel (a tiny invisible image) loads inside the recipient’s email client. When that image loads, the sender’s server logs a hit and counts the message as opened. The mechanism has worked reasonably well for years, but it has one critical flaw: it only records opens when images are loaded. That flaw became catastrophic in September 2021 when Apple released iOS 15.
Before we get to that, though, let’s anchor around what “good” has historically meant.
Why There Is No Single “Good” Open Rate
Ask ten email marketers what a good open rate is and you will get ten different numbers. Some will say 20%. Others will say 50%. Both can be right, because context changes everything. The following factors all shift the benchmark dramatically:
- Campaign type (cold outreach vs. newsletter vs. transactional)
- Industry vertical (SaaS vs. e-commerce vs. non-profit)
- List quality (opted-in subscribers vs. scraped contacts)
- Sender reputation (warm domain vs. fresh domain)
- Subject line approach (personalized vs. generic)
- Audience relationship (existing customer vs. cold prospect)
- Send volume (10 emails vs. 10,000 emails)
A cold sales email sent to 50 perfectly researched prospects should hit 60-70% open rates. A newsletter sent to 50,000 subscribers is doing very well at 30%. Comparing these two numbers side by side is meaningless. The metric only tells you something useful when you control for context.
Email Open Rate Benchmarks by Industry and Campaign Type
Despite the caveats above, benchmarks provide a starting reference. Here is how open rates typically distribute across major sectors and campaign formats, based on aggregate data from major ESPs (though remember these figures are increasingly inflated by Apple MPP, discussed below):
Cold Outreach (B2B Sales Emails)
| Segment | Typical Open Rate Range |
|---|---|
| Highly targeted (10-50 contacts) | 55-75% |
| Well-researched (50-200 contacts) | 40-60% |
| Moderate targeting (200-1000) | 25-45% |
| Broad / mass outreach | 10-25% |
Cold emails to a tightly defined ICP (Ideal Customer Profile) with strong personalization regularly exceed 60%. This is not magic; it is list hygiene and relevance. When you send fewer, better emails to the right people, more of them open.
B2B Newsletters and Nurture Sequences
| Category | Average Open Rate |
|---|---|
| B2B newsletters (engaged list) | 28-42% |
| Product nurture sequences | 22-35% |
| Re-engagement campaigns | 12-20% |
| Event / webinar invites | 35-55% |
By Industry Vertical
| Industry | Average Open Rate |
|---|---|
| Non-profit / Education | 35-45% |
| Financial Services | 22-30% |
| SaaS / Technology | 20-28% |
| E-commerce / Retail | 18-25% |
| Healthcare | 28-35% |
| Recruiting / HR | 30-40% |
These figures should be treated as directional ranges, not hard targets. Your own historical baseline matters far more than any industry average.
Apple Mail Privacy Protection: Why Your Open Rate Is Probably Lying to You
In September 2021, Apple launched Mail Privacy Protection (MPP) as part of iOS 15, iPadOS 15, and macOS Monterey. The feature works like this: when a user opts in (and the majority have), Apple pre-fetches all email content through its own servers before the user even opens the message. This means the tracking pixel fires automatically, registering an “open” regardless of whether the person ever actually reads the email.
The result: open rates reported by ESPs jumped overnight for senders whose lists include significant numbers of Apple Mail users. In many B2B audiences, Apple Mail users represent 40-60% of the list. That means a substantial portion of every “open” you see in your dashboard is a phantom open triggered by Apple’s proxy, not by a human.
What this means in practice:
- A campaign showing 52% open rate might have a real human open rate of 30-35%
- A/B testing subject lines based on open rate is now unreliable if your audience skews Apple
- Benchmarks published before 2022 are not directly comparable to 2024-2026 data
- Any ESP reporting inflated opens is giving you a false sense of performance
The only reliable fix is to stop using open rate as a primary decision metric and shift to metrics that cannot be faked by proxy servers.
How to Evaluate Whether YOUR Open Rate Is Actually Good
Instead of comparing to industry averages (which are distorted by MPP and context differences), the most reliable benchmark is your own historical performance. Here is a practical framework:
Step 1: Establish a Pre-MPP Baseline (If You Have One)
If your campaigns predate September 2021, you have a reference point. Compare your current reported open rates to that baseline with a critical eye: any sudden jump in late 2021 is likely MPP inflation, not genuine improvement.
Step 2: Segment Your Audience by Email Client
Most ESPs (HubSpot, Lemlist, Instantly, Mailchimp) offer email client breakdowns. Isolate non-Apple opens (Gmail, Outlook, etc.) and track that subset separately. This gives you a cleaner signal of real human behavior.
Step 3: Track Open Rate Trends, Not Absolute Numbers
A declining open rate trend over consecutive campaigns to the same list is meaningful, regardless of the absolute number. It signals deliverability degradation, list fatigue, or relevance decline. Rising trends indicate the opposite.
Step 4: Cross-Reference with Click Rate and Reply Rate
Open rate in isolation tells you almost nothing. But open rate + click rate + reply rate together paint a full picture. If you have a 45% open rate but 0.5% reply rate, your subject lines are working but your email body copy is not. If your open rate is 20% but reply rate is 8%, you have a deliverability issue (fewer people see it) but strong relevance for those who do.
7 Key Levers That Affect Open Rate
Even with MPP muddying the waters, open rate is still worth optimizing because it correlates with real engagement. Here are the seven levers that move the needle most:
1. Email Deliverability
Deliverability determines whether your email reaches the inbox at all. If you land in spam, your open rate collapses regardless of how good your subject line is. Protect deliverability by warming new domains gradually, maintaining sender reputation, keeping bounce rates below 2%, and using proper SPF/DKIM/DMARC authentication.
2. Subject Line Quality
The subject line is the single biggest lever for open rate. Short (3-7 words), curiosity-driven, or hyper-personalized subject lines consistently outperform generic ones. Avoid spam-trigger words (“Free,” “Guaranteed,” “Act Now”) and test variations systematically.
3. Sender Name and Address
People open emails from people they recognize or trust. A sender name like “Simon from Zeliq” almost always outperforms “marketing@zeliq.com.” Use a real first name and a legitimate company domain. Avoid no-reply addresses and role-based addresses like info@ or sales@.
4. List Quality and Hygiene
A clean, verified list of contacts who match your ICP will always outperform a large, unverified list. Remove bounced addresses immediately, suppress unengaged contacts after 90-120 days, and validate emails before launching campaigns. Tools like Zeliq’s B2B contact data finder help you source contacts with verified emails from the start, reducing bounce rates and protecting sender reputation.
5. Send Timing and Frequency
Tuesday through Thursday mornings (8-10 AM in the recipient’s timezone) consistently show higher open rates for B2B audiences. But frequency matters just as much as timing: emailing the same prospect every two days trains them to ignore you. Space follow-ups appropriately, and never exceed 3-4 touchpoints per sequence to cold prospects without explicit engagement signals.
6. Audience Segmentation
Segmenting your list by industry, company size, seniority, or intent signals dramatically improves open rates. A VP of Sales at a 200-person SaaS company has completely different concerns from a Marketing Manager at an agency. Relevant emails get opened. Generic emails get archived.
7. Preview Text Optimization
The preview text (the snippet shown after the subject line in most email clients) is often overlooked. It functions as a second subject line and can add meaningful context that tips a recipient toward opening. Never let it default to “View in browser” or boilerplate text; write it intentionally as a complement to your subject line.
Why Reply Rate Is the Metric That Actually Matters
Here is the uncomfortable truth: open rate has never been the metric you should care about most in sales outreach. Even before Apple MPP distorted the data, an open was just an open. It cost the recipient nothing to open an email and do absolutely nothing. What you actually want is a response, a meeting booked, a deal started.
Reply rate (the percentage of delivered emails that generate a reply) is the metric that directly correlates with pipeline:
- Cold outreach reply rate: 5-15% is strong; above 15% is exceptional
- Newsletter reply rate: Even 1-3% represents genuine human engagement
- Nurture sequence reply rate: 3-8% indicates strong relevance
Reply rate cannot be faked by a proxy server. It requires a human to read, process, and respond. It is the cleanest signal of message relevance and campaign effectiveness available.
For B2B sales teams, a complementary metric worth tracking is positive reply rate (replies that express interest, not just “unsubscribe me”), which more directly maps to pipeline contribution.
If your team is still optimizing primarily for open rate, it is worth asking whether you are optimizing for the right thing. Open rate is a leading indicator at best, a misleading vanity metric at worst. Reply rate, meeting booked rate, and ultimately pipeline generated are the numbers that connect outreach to revenue.
From Benchmarks to Action: Combining the Right Data With the Right Tools
Understanding benchmarks is only useful if you can act on them. The most effective outreach teams combine strong data quality (accurate emails, verified contacts), thoughtful segmentation (the right message to the right person), and a clear multichannel strategy that does not rely solely on email.
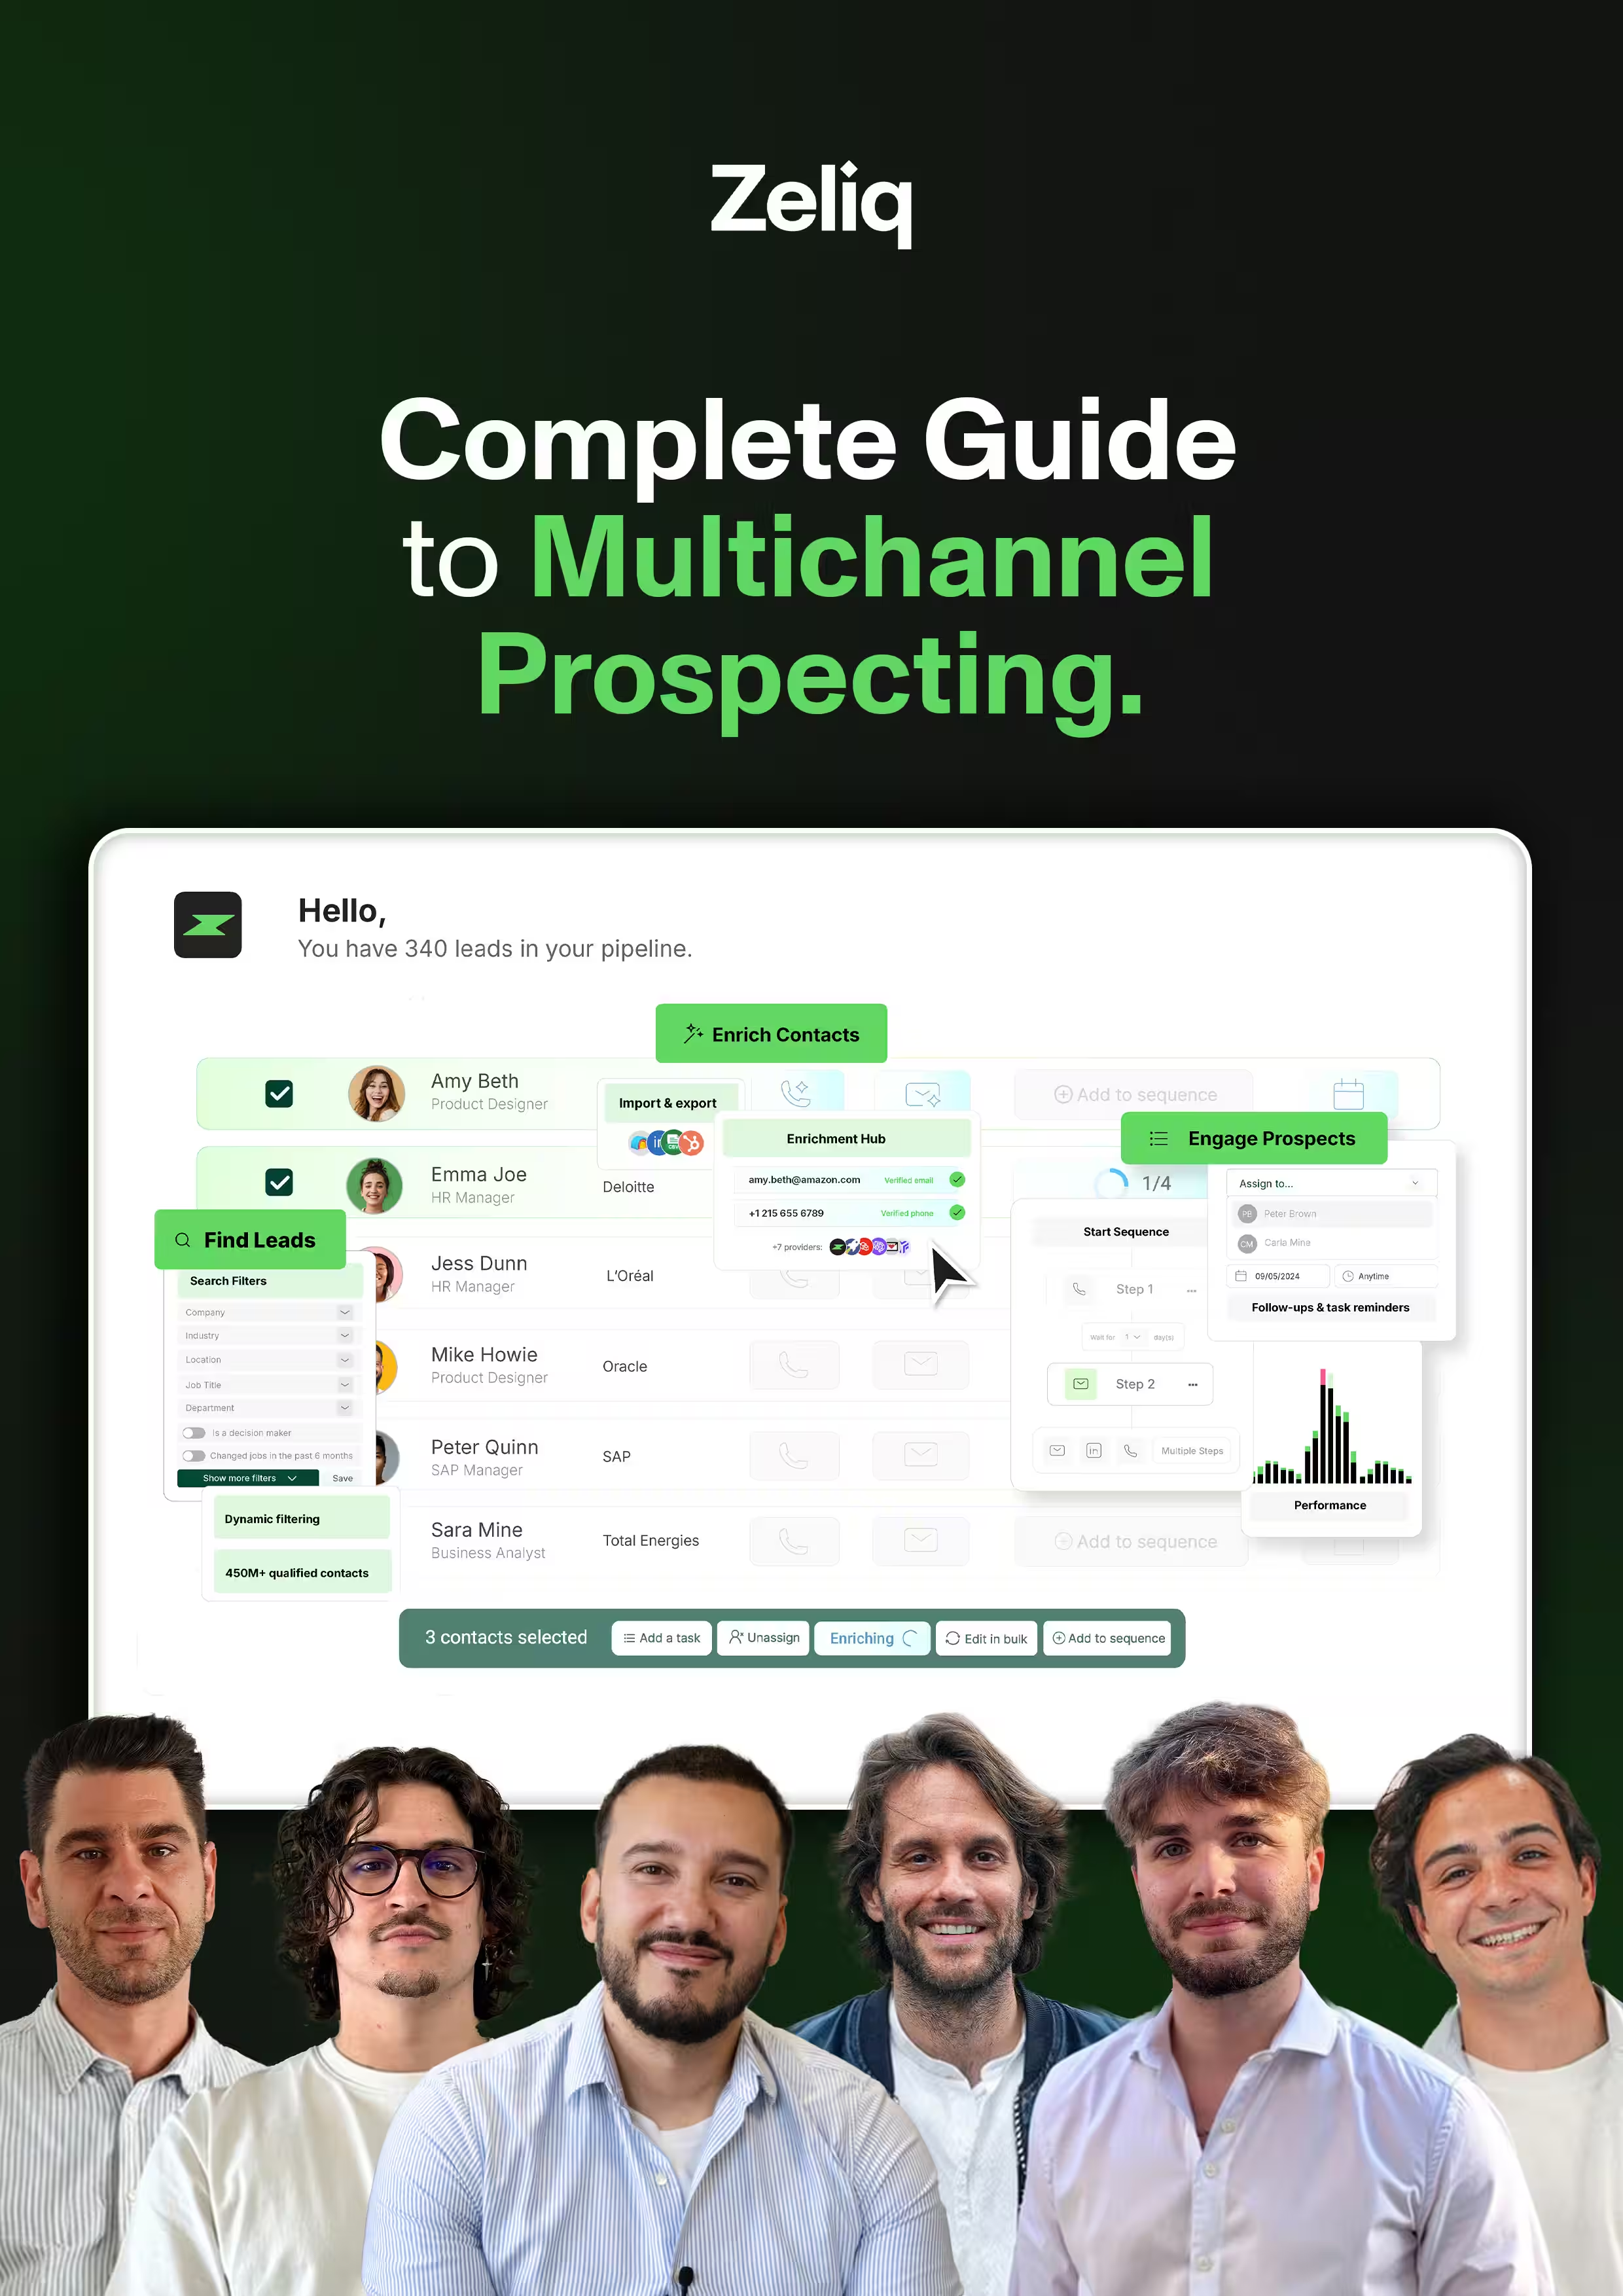
When outreach extends to LinkedIn, calls, and email in coordinated sequences, the pressure on any single channel’s open rate decreases, because you have multiple pathways to start a conversation. Zeliq’s multichannel prospecting features let you orchestrate these sequences from one place, so your team is not chasing open rate benchmarks on a single channel but building relationships across the touchpoints that convert.
Similarly, if your open rates are declining, the issue is often not the subject line but the underlying data quality: outdated job titles, incorrect emails, contacts who have left the company. Enriching your B2B data before launching a campaign is one of the highest-leverage moves available to any outreach team.
Quick Reference: What Does a Good Open Rate Look Like?
| Campaign Type | Strong Open Rate | Context |
|---|---|---|
| Cold outreach (tight ICP, 50 contacts) | 55-70% | Highly personalized, verified list |
| Cold outreach (broader, 500 contacts) | 30-50% | Good segmentation, clean data |
| B2B newsletter | 28-40% | Opted-in, engaged subscribers |
| Nurture sequence | 22-35% | Relevant content cadence |
| Re-engagement campaign | 12-20% | Lapsed contacts |
Remember: all figures above are increasingly inflated by Apple MPP. Add a mental discount of 10-20 percentage points for any audience with significant Apple Mail usage, and cross-reference with reply rate before drawing conclusions.
The Bottom Line
A good email open rate is one that is improving relative to your own baseline, measured in context, and paired with strong reply rate signals. The specific number matters far less than the trend and the actions it drives. Industry benchmarks are useful guardrails, not hard targets. And in 2026, with Apple MPP having permanently altered the open tracking landscape, any team still treating open rate as their primary outreach KPI is flying on instruments that have been recalibrated by a third party.
Focus instead on: list quality, personalization depth, reply rate, and ultimately meetings booked. Those are the numbers that connect directly to revenue, and they are the ones worth optimizing.
Ready to run outreach that actually converts? Zeliq gives you verified B2B contacts, enrichment, and multichannel sequencing in one platform so you can stop guessing and start booking meetings.
Try Zeliq for freeEnter the future of lead gen