
In B2B, every lead you chase comes with a cost. Cost per lead (CPL) has become the north star for measuring efficiency across sales and marketing. With media prices climbing and buyer attention shrinking, knowing your average cost per lead is no longer a reporting metric: it’s a strategic lever.
Across industries (from financial services and legal services to B2B SaaS and real estate) CPL benchmarks reveal how much companies really spend to attract qualified leads and move them through the customer journey. Recent multi-channel studies* suggest that in 2025, the average B2B cost per lead sits around $200, with variations depending on industry and funnel stage.
Modern lead generation costs span everything from Google Ads, Facebook Ads, and email marketing to SEO content and social media campaigns.
SOURCES :
- Most businesses spend an average of $188 per lead on multi-channel prospecting ⇒ https://sopro.io/resources/blog/b2b-cost-per-lead-benchmarks
- Top-of-funnel leads range from $65 to $250, depending on the channel and industry ⇒ https://lead-spot.net/how-much-do-b2b-leads-cost-in-2025-benchmarks-by-channel-industry-and-funnel-stage
Your marketing strategy now lives or dies on precision:
- target the wrong audience, and your CPL spikes;
- align content, channel, and offer, and your conversion rates rise while costs drop.
The smartest teams treat CPL as part of demand generation ROI, linking every marketing effort and acquisition cost back to customer lifetime value and payback.
This guide breaks down B2B cost per lead benchmarks, key marketing channels, and proven tactics to lower generation cost, helping you turn data into predictable pipeline growth.
What is cost per lead (CPL)?
In B2B, every dollar you spend at the top of the funnel has to earn its way down. Cost per Lead (CPL) shows exactly how efficiently that happens.
The formula and what it really means
The math isn’t complicated:
CPL = Total lead generation costs / Number of qualified leads
What matters is what you call a lead:
- Some teams count a Marketing Qualified Lead (MQL - a contact that fits your ICP and shows engagement).
- Others only count a Sales Qualified Lead (SQL - someone who’s booked a meeting or replied with clear intent).
A loose definition might make your numbers look better, but it usually means lower win rates later on. Precision here protects your pipeline.
CPL, CPA, CAC : samefamily, different jobs
These acronyms get mixed up all the time, but they measure different stages of value:
- CPL: the cost to get a hand-raise, a signal of real interest.
- CPA (Cost per Action): the price of a specific action, like a demo signup or webinar registration.
- CAC (Customer Acquisition Cost): what you spend across sales and marketing to turn leads into customers.
Think of CPL as the speedometer at the top of your funnel, while CAC is your mileage tracker for the entire journey.
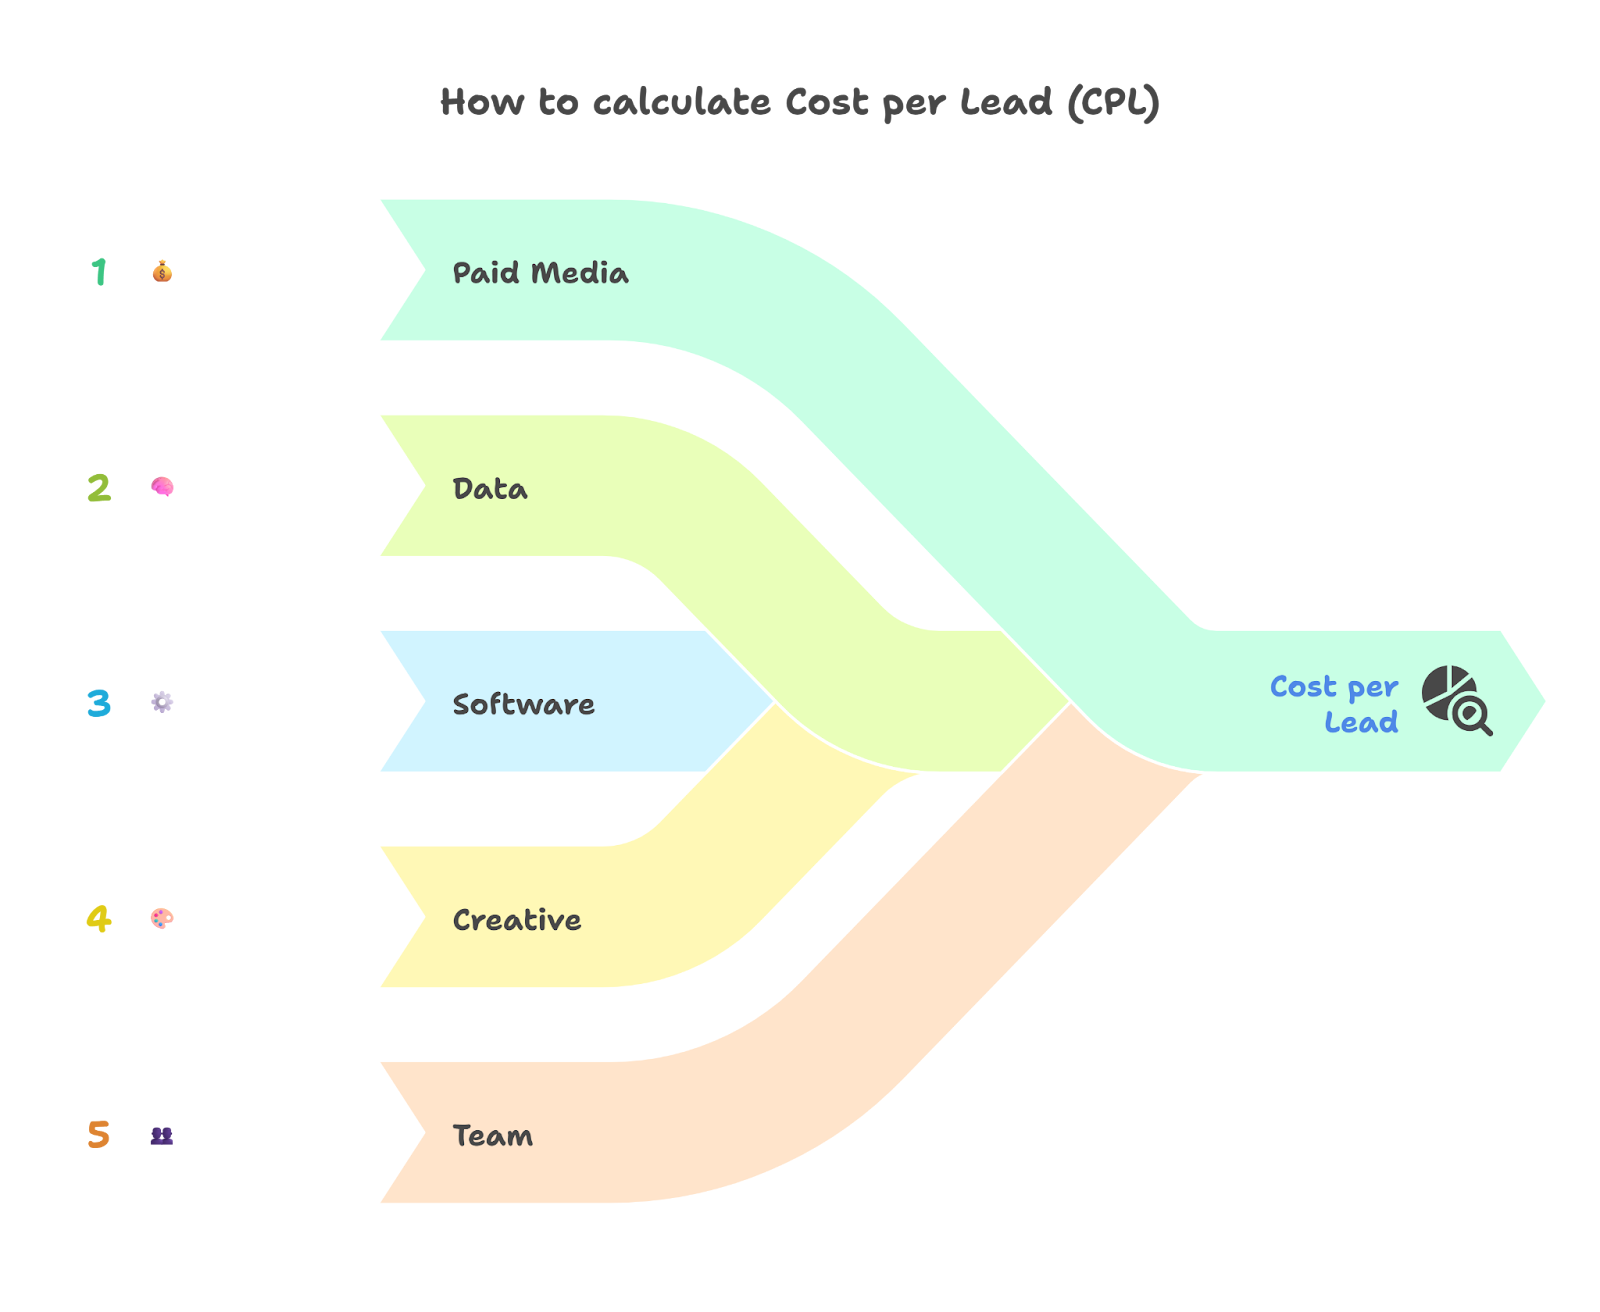
What’s actually included in CPL
If you want a realistic picture, include every dollar that goes into getting new leads:
- Paid media: Google Ads, LinkedIn campaigns, programmatic…
- Data: contact lists, enrichment tools, intent providers
- Software: sequencing tools, CRMs, automation platforms
- Creative and content: design, copy, landing pages
- Events and trade shows
- A fair slice of team costs: SDRs or marketers focused on lead generation
Why CPL still matters
Marketers love new metrics, but CPL is still the best early signal of how efficiently your funnel runs.
The big change is how we calculate it: AI-driven intent data and lead scoring now make qualification sharper, helping teams spend smarter, not just less.
Across B2B, CPL benchmarks swing widely: from $30 to $200 per qualified lead depending on channel mix, industry, and sales cycle.
But chasing the lowest number rarely wins. The real goal is quality leads at a sustainable cost, not cheap ones that never convert.
How to calculate cost per lead (CPL)
Precision matters. A small mistake in what you count or how you log it can distort your numbers fast.
Here’s how to get it right, step by step.
1. Set the denominator: define the “lead”
Start by choosing one definition and stick to it.
Consistency is key. If your marketing team calls a whitepaper download a “lead”, while sales only logs meetings, your CPL will tell you nothing useful.
The best teams align on one clear definition.
2. Build the numerator: add up every attributable cost
Next, total every dollar connected to generating those leads during the same period. That includes:
- Media spend (Google, LinkedIn, display)
- Tools and platforms (ZELIQ sequences, email verification, automation)
- Data acquisition and enrichment
- Creative and content costs
- Event participation
- A proportion of SDR or marketing headcount focused on top-of-funnel
If the cost helps create or qualify a lead, it belongs in the numerator. Ignore post-sale costs: they’ll distort the view.
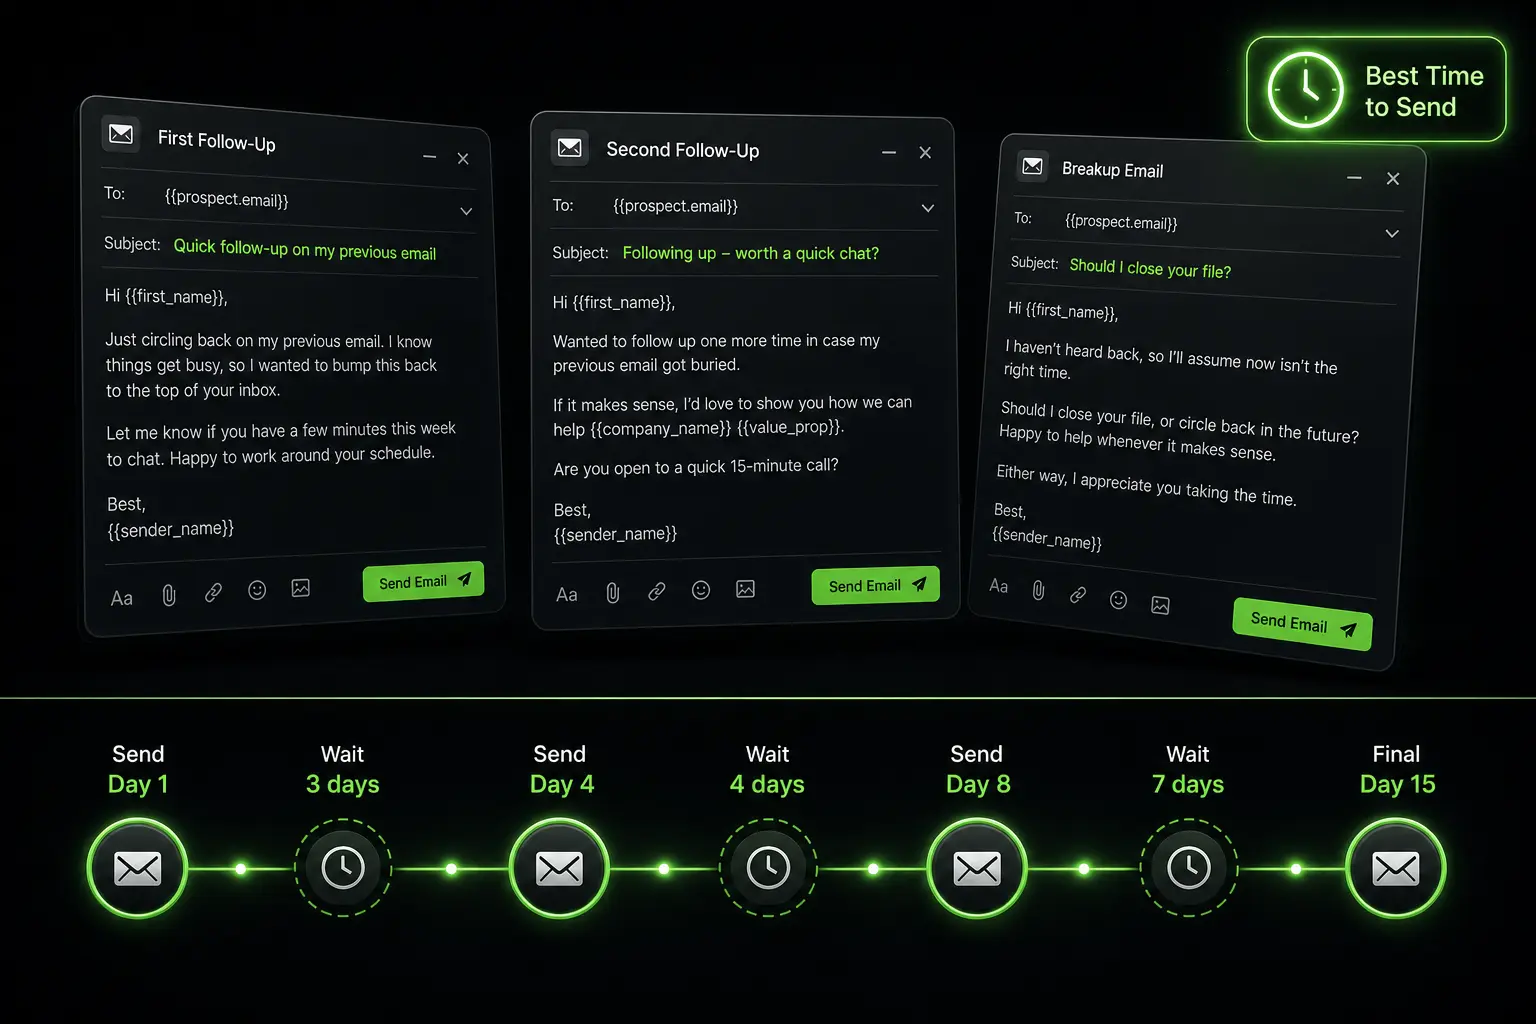
3. Choose Your Attribution Model
For a quick snapshot, use last-touch: it’s easy to track and good enough for fast-moving teams.
For a more accurate picture, use a multi-touch model. It spreads cost across every touchpoint that contributed to the lead.
Worked examples (realistic scenarios)
Each example shows how CPL changes depending on the channel mix, audience intent, and qualification criteria. Trade shows may look costly, but they often bring higher deal values.
4. Keep your data clean
A dirty database can inflate CPL overnight.
To stay accurate, use this checklist every month before running new campaigns:
Clean your database
- Remove duplicates (both contacts and companies).
- Delete bounced or inactive email addresses.
Enforce ICP fit
- Add tags for industry, role, and company size.
- Filter out students, personal emails, and non-B2B domains.
Standardize lead stages
- Ensure MQL and SQL are logged consistently in your CRM.
Verify and authenticate
- Run list verification tools before launching campaigns.
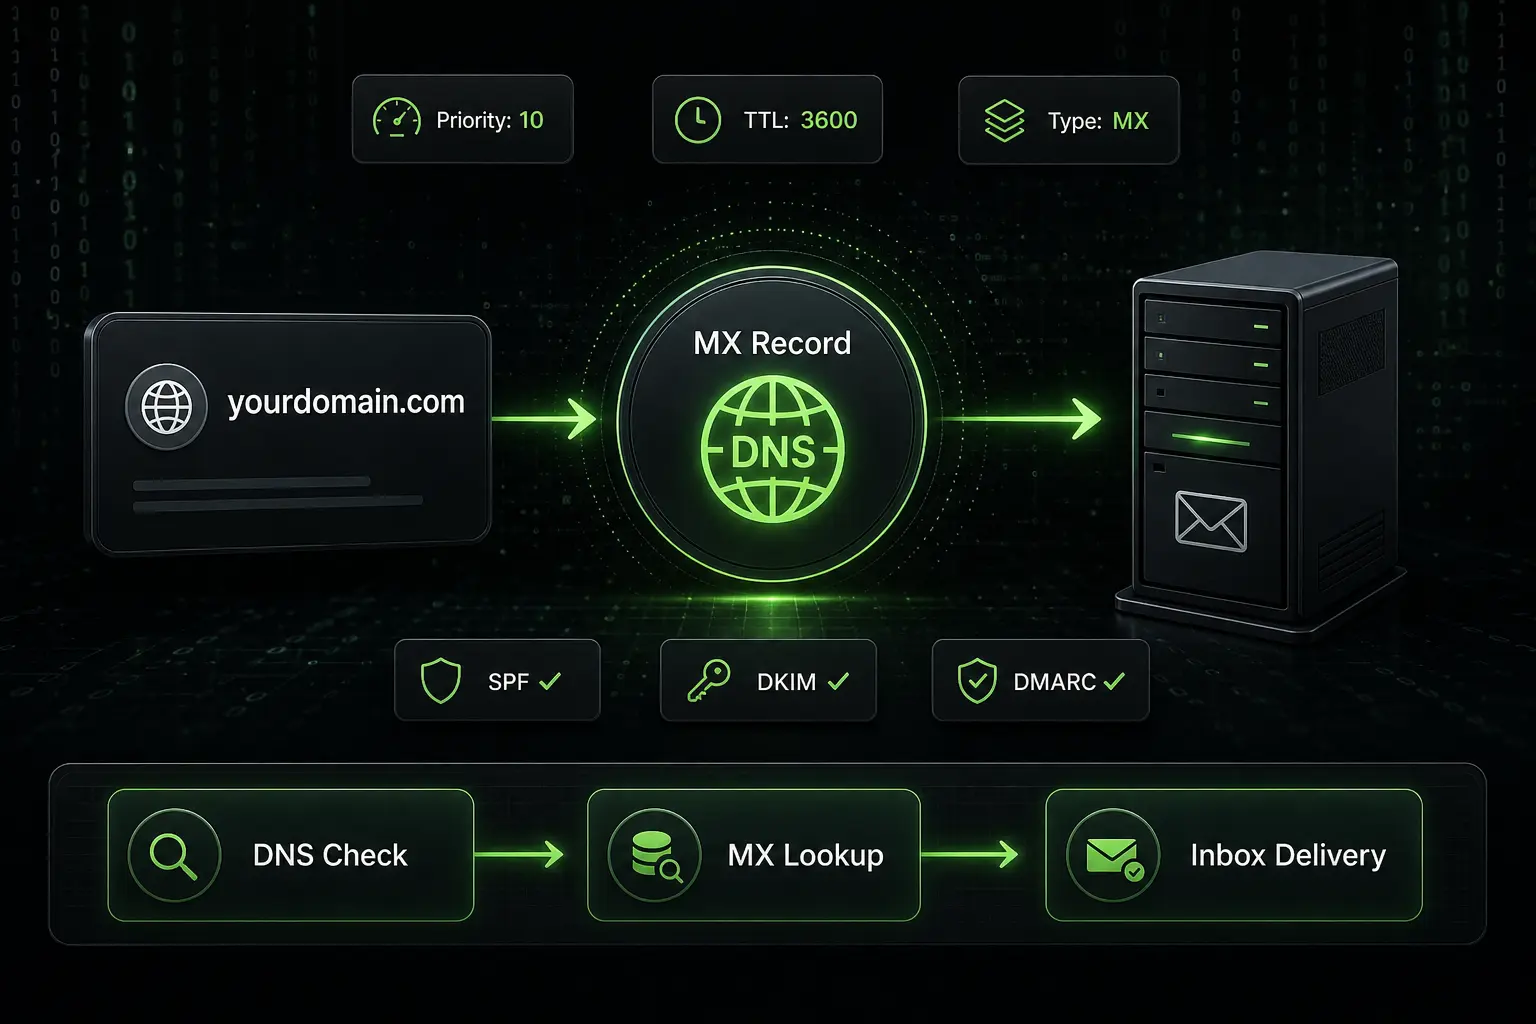
- Maintain SPF, DKIM, and DMARC records for all sending domains.
These steps are the fastest, most controllable way to improve CPL accuracy and efficiency.
5. Report and review
The best teams track CPL in rhythm:
- Weekly: channel-level pulse checks.
- Monthly: close the books, apply attribution, and validate numbers.
- Quarterly: reset baselines: targets, ICPs, pricing.
A modern sales dashboard should display CPL, SQL rate, opportunity rate, win rate, and effective CPL per opportunity.
What are the trends in lead generation costs?
Before jumping into trends, it’s worth taking a step back.
Your lead generation experience says a lot about the kind of business you’re building. Each campaign, ad, or SEO article is part of a bigger learning process. Understanding what your target audience values and what drives them to act.
Whether you’re in staffing, SaaS, or professional services, your cost per lead is really a mirror of your digital maturity and how clearly your brand connects with decision-makers.
The cost of generating a B2B lead has never been static, but 2024-2025 sharply accelerated that trend.
A mix of media inflation, privacy restrictions, and AI-driven automation is reshaping how teams spend, measure, and control CPL across every channel.
Media inflation and privacy are reshaping acquisition
Ads platforms are charging more for less reach. Average CPC and CPM rates have climbed, as digital inventory tightens and competition intensifies.
At the same time, stricter privacy regulations are limiting third-party tracking, forcing teams to rely on first-party data: cleaner, but harder to scale.
For most B2B marketers, that means higher paid social and search CPLs and a heavier focus on data hygiene and consent-based targeting.
AI and automation are redefining efficiency
AI has quietly rewritten the cost equation.
And now, AI doesn’t just automate, it teaches. Many teams use it to compare CPL benchmarks across industries or forecast future performance based on real lead statistics.
This kind of predictive layer helps marketers spot where their campaigns are drifting from average CPL standards or where ROI might drop. But it also adds a new challenge: knowing how to read the data. The goal isn’t just to collect numbers: it’s to make sense of them and adjust your sales funnel in real time.
Copy generation, campaign testing, and list segmentation that once took hours now happen in minutes.
That efficiency lowers labor share but raises a new challenge: quality control. Automated prospecting only works when your inputs (data, prompts, targeting rules) are solid.
Inbox & deliverability: the new outbound battleground
Cold outreach still works, but email rules are tightening.
Providers now enforce authentication standards like SPF, DKIM, and DMARC, and even flag links without custom tracking domains.
Ignoring these signals means lower deliverability and a sudden spike in CPL for outbound.
Events are back, but expensive
Trade shows and in-person events have made a full comeback, but they’re not cheap.
Average CPLs now exceed $800 once you add booth space, logistics, and staff travel.
What this means for CPL in 2025
- Paid social and search: expect rising CPLs, especially in tech and financial verticals.
- Outbound: remains competitive if your data quality, intent filters, and messaging are tight.
- Partner programs and webinars: deliver mid-range CPLs but stronger trust and better down-funnel economics.
- Organic SEO and retargeting: still the most cost-efficient plays, often around $30 per qualified lead.
Companies using a multi-channel strategy (blending paid, outbound, and organic) are seeing average CPLs drop, proving that diversification still beats optimization in silos.
What is the impact of marketing strategies on CPL?
In 2025, managing Cost per Lead is more about engineering relevance. The way you define your ICP, design offers, and orchestrate channels has a direct and measurable impact on CPL and, more importantly, on the cost of generating qualified opportunities.
ICP precision
A refined Ideal Customer Profile (ICP) ; filtered by industry, company size, tech stack, and pain signals like hiring SDRs or switching CRMs ; will likely increase your raw CPL.
Tighter targeting produces better-fit leads, meaning your effective CPL per SQL or opportunity drops.
Offer and friction design
Your offer and the level of friction built into your funnel shape lead volume and quality.
- Bottom-of-funnel (BOFU) offer, like product demos or pricing consultations, attract fewer leads but higher intent. They only reduce CPL if the audience is already problem-aware.
- Top- and mid-funnel (TOFU/MOFU) assets, such as ROI calculators, executive briefs, or checklists, drive volume fast. However, without tight qualification, they risk inflating your CRM with noise.
The goal isn’t just to fill the pipeline: it’s to ensure every click, download, or signup has sales potential.
Channel mix & sequencing
Single-channel campaigns are dying out. Blending cold email, LinkedIn touchpoints, and phone outreach within coordinated sequences increases engagement while keeping CPL stable.
Layering in intent signals (like site visits, job changes, or new tech installs) lets SDRs prioritize the right accounts, trimming waste and lifting conversion rates.
The hidden power of nurture
High CPL doesn’t always mean poor performance: sometimes it just means “not yet.”
A structured nurture motion turns expensive early leads into SQLs over 90-180 days, without additional acquisition spend.
Nurture programs often reduce effective CPL by 40% or more.
Smart marketing strategies don’t obsess over lowering raw CPL.
They manage effective CPL ; optimizing quality, timing, and fit across the funnel.
How does lead generation cost vary?
Your channel mix, lead definition, and industry economics all shape what you actually pay to get a qualified hand-raise. Understanding those levers helps you plan smarter, and defend your budget if Finance asks why “one lead” costs $40 in one channel and $400 in another.
Lead Generation cost varies :
By channel
- Cold email (well-run): typically low to mid-range CPL. Most of the cost comes from data, enrichment, and verification, plus the SDR time that powers your sequences.
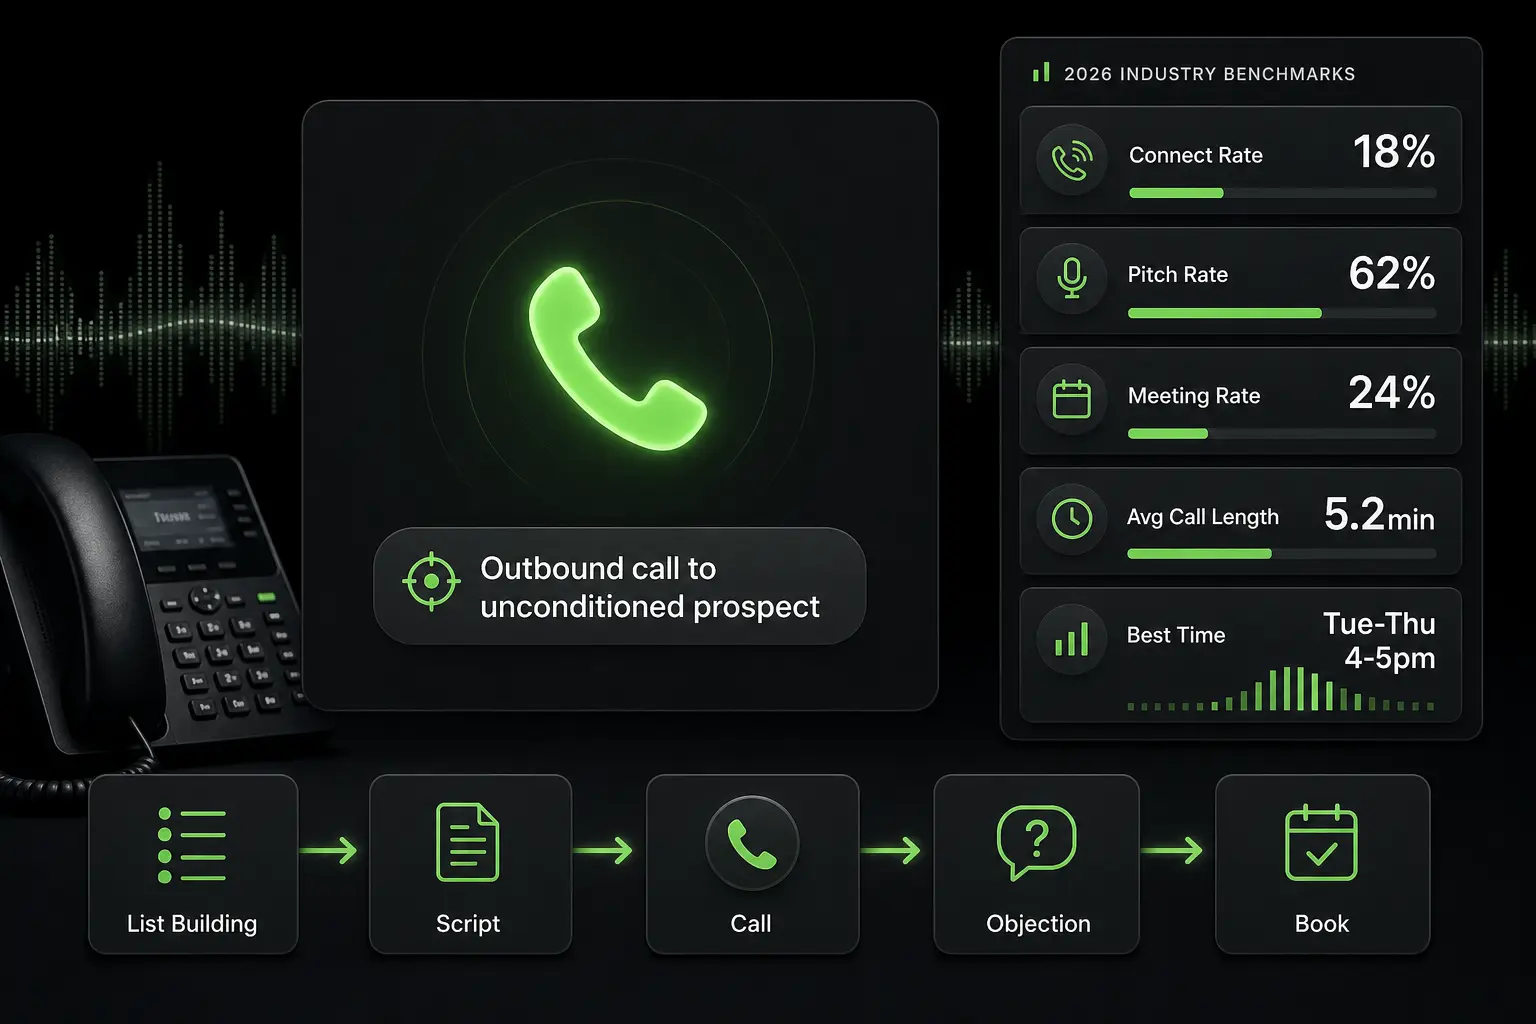
- Cold calling: labor-heavy and unpredictable. Your CPL rises or falls with connect rates and how well reps convert conversations into meetings.
- LinkedIn Ads: usually on the expensive side, but unmatched in targeting precision. CPL shifts depending on whether you’re using lead forms (cheaper, lower intent) or driving traffic to your website (more expensive, higher quality). For a deeper breakdown of how to turn that spend into qualified pipeline, see our guide to LinkedIn lead generation.
- Google Search Ads: intent-rich but competitive, with costs spiking on high-value keywords and dropping on long-tail or branded terms.
- SEO & Content Marketing: front-loaded investment that compounds. CPL starts higher but falls sharply as your content begins to rank.
- Webinars & Virtual events: mid-range CPL that rises with paid promotion. However, the leads tend to be better informed and more sales-ready.
- Trade Shows: the top of the cost pyramid. Returns depend entirely on your post-event follow-up speed, within 24-48 hours.
- Partners & affiliates: highly variable. Pay-per-lead models can be efficient, but only if you define what “qualified” means upfront and enforce it tightly.
By lead definition
The tighter your definition, the higher your CPL, but also the higher your confidence in pipeline quality.
Form fill < MQL < SQL (meeting) < Sales-Accepted Opportunity (SAO)
A broad definition keeps costs low but bloats your CRM with noise. For practical planning, always align your CPL target with the sales stage your team actually needs (usually meetings or SQLs).
By industry and deal size
CPL tolerance scales with deal value.
- High-ACV industries (like legal, financial services, or enterprise SaaS) can justify $200+ CPLs, because one conversion offsets hundreds of missed leads.
- SMB and volume-driven sectors need to stay lean. When your average deal size is $2K-$5K, a $150 CPL destroys unit economics.
What are the benchmarks for B2B leads?
Benchmarks are guardrails. Your Cost per Lead (CPL) will always flex based on your ICP, sales motion, and channel mix.
But in 2025, these directional ranges offer a useful pulse check for planning and performance reviews :
Benchmarks by Channel and SQL Rate (2025 Averages)
“Good CPL” vs. “good business”
The smartest revenue teams don’t chase the lowest CPL, they chase the most efficient CPL per opportunity.
- A $180 lead that converts to an opportunity 25% of the time equals an effective CPL of $720 per opportunity.
- A $60 lead converting at 3% ends up costing $2,000 per opportunity.
Which is really “cheaper”?
- Raw CPL tells you what you paid.
- Effective CPL tells you what it’s worth.
Use CPL not as a vanity metric, but as a diagnostic tool: tying every dollar spent to the creation of qualified pipeline.
What are the average lead generation costs by industry?
CPL follows the economics of your market.
Every sector carries its own mix of audience complexity, compliance, and deal value, and those forces shape what you’ll pay to capture qualified demand.
Here’s how it plays out across industries in 2025:
B2B SaaS
Expect mid to high CPLs.
The category is crowded, and committee-based buying means longer cycles and heavier nurturing. With multiple stakeholders influencing the deal, even great campaigns need more touches to generate meetings.
Still, recurring revenue and lifetime value justify higher acquisition costs.
Financial services
Among the highest CPLs in B2B.
Strict compliance, trust requirements, and regulated messaging limit creative freedom and slow conversion.
However, once qualified, leads tend to show higher deal values and renewal potential.
Legal services
Also high-cost, typically due to specialized audiences and long decision timelines.
Each lead often represents a niche role with narrow intent windows, so qualification and personalization become critical.
Educational content and authority-led outreach (webinars, white papers) often perform best.
Manufacturing & industrial
Mid-range CPLs.
The audiences are technical and niche, but highly engaged once reached.
SEO, product explainers, and detailed use cases generate consistent results, and CPL drops significantly once organic authority builds.
Staffing & recruiting
CPLs vary widely depending on timing.
When outreach aligns with active hiring cycles, outbound campaigns convert efficiently. Miss the timing, and costs spike.
Data freshness and trigger-based targeting (job postings, funding events) make all the difference.
Real estate (B2B / Commercial)
Typically higher CPLs, driven by local market dynamics and long sales cycles.
Relationship-based sales dominate, so leads take more nurturing.
Success often depends on hyper-local content and in-person engagement.
Professional services & consulting
Mid to high CPLs with a heavy emphasis on authority marketing.
Think case studies, client ROI stories, and point-of-view papers.
These assets improve trust and lower the effective CPL by increasing SQL and opportunity conversion rates.
Drivers behind CPL variance
- Audience size and specificity: niche or senior audiences are harder (and pricier) to reach.
- Buyer seniority and deal complexity: selling to C-suite or committees increases qualification time.
- Regulation and compliance: financial, legal, and healthcare industries face higher acquisition friction.
- Offer type and friction level: demos and pricing calls produce fewer, costlier leads; low-friction offers (checklists, ROI tools) scale volume but require strong qualification filters.
Ultimately, your CPL target should mirror your deal size and funnel strategy.
How to calculate cost per lead
To keep calculations consistent and audit-proof, use a structured CPL calculator.
👉 Download our free CPL calculator
The tool helps you:
- Identify your blended CPL across all marketing activities
- Track effective CPL per SQL or opportunity
- Spot cost inefficiencies before they snowball
Inputs
⇒ Costs:
- Paid media (Google, LinkedIn, display)
- List and data acquisition
- Verification & enrichment tools (e.g., ZELIQ, CRM integrations)
- Marketing tech stack (sequencing, tracking, automation)
- Creative, design, landing pages, and content production
- Event and webinar expenses
- Contractor or agency fees
- Allocated payroll — SDRs and marketing staff focused on top-of-funnel
⇒ Leads:
- Define the stage: MQL, SQL, or meeting booked
- Track consistently across all campaigns and timeframes
⇒ Attribution model:
- Single-touch (last-touch)
- Multi-touch (linear or position-based)
- Include a blended CPL across all channels for holistic insight
⇒ Outputs & diagnostics
- CPL by channel, campaign, and total blended CPL
- Conversion from CPL → SQL → Opportunity → Win
- Effective CPL per opportunity
- Heatmaps or dashboards segmented by industry, title, company size, and region
With this structure, you’re diagnosing funnel efficiency and identifying where to redeploy spend for maximum return.
FAQ
What is a “good” CPL in B2B?
There’s no universal “good” CPL: it depends on your industry, channel, and deal economics.
For context, financial services often see averages around $450-$500, while B2B SaaS sits closer to $200-$250.
The real metric to watch is effective CPL: the cost per lead that actually turns into an opportunity or customer.
A $200 lead that converts at 20% is far healthier than a $60 lead that never moves past MQL.
Why is my CPL rising month over month?
Rising CPL is one of the most common pain points in 2025. The usual suspects:
- Media inflation (higher CPCs and CPMs)
- Privacy restrictions reducing ad targeting precision
- Deliverability dips from email domain issues
- Market saturation driving up competition in core channels
Should I count SDR salaries in CPL?
Yes: at least the portion tied to top-of-funnel work.
If your SDRs spend 50% of their time prospecting or qualifying inbound leads, that half of their cost belongs in your CPL model. Also include tools, enablement, and management overhead.
How do I compare CPL across channels fairly?
Fair comparisons come down to definition, time frame, and attribution.
- Use the same lead definition across channels (e.g., “booked meeting”).
- Align reporting periods.
- Stick to one attribution model, but don’t mix them.
Then, compare both raw CPL and effective CPL (cost per SQL or opportunity).
Volume and quality tell different stories, and you need both.
How often should benchmarks be updated?
Quarterly at minimum.
Media costs, privacy policies, and market competition shift too fast for annual benchmarking to stay relevant.
Run monthly pulse checks by channel, then reset targets quarterly with fresh data.
This rhythm keeps your CPL goals tied to the market reality (not last year’s spreadsheet).
Mastering your cost per lead (CPL) isn’t about chasing the lowest number: it’s about building a predictable, high-quality pipeline where every dollar works harder. The right tools make that precision possible.
Start your free trial of Zeliq
to automate prospecting, clean your data, and cut your CPL without cutting your results.
Table of contents
Placeholder Title
Table of contents
Placeholder Title
Placeholder Title