
Dans le marketing B2B, il ne suffit pas de se demander ce qu'est un bon taux à chaque étape. Votre taux de conversion de l'entonnoir de vente détient les clés pour transformer les visiteurs en clients payants, augmenter la taille moyenne des transactions et stimuler la croissance des entreprises.
Au lieu d'un seul chiffre de « taux de conversion », la solution intelligente consiste à effectuer une analyse étape par étape de l'entonnoir: visiteur → lead, lead → MQL, MQL → SQL, SQL → opportunité et opportunité → Closed‑won.
Pour chacune de ces transitions, il existe des points de référence du secteur qui montrent vos performances par rapport aux meilleurs. Ces points de référence aident même les équipes les plus performantes à identifier les domaines dans lesquels leur entonnoir est moins performant (qu'il s'agisse du lead nurturing, du taux d'activation ou de l'adoption de fonctionnalités).
Lorsque les équipes marketing et commerciales parlent le même langage (s'accordent sur ce qui constitue un prospect qualifié, sur le déroulement du processus de vente et sur la manière dont l'UX influence les conversions), l'ensemble du parcours client devient plus solide. En mesurant chaque étape, du visiteur au prospect en passant par le client payant, vous pouvez :
- déterminez votre coût d'acquisition client (CAC),
- repérer les points faibles du cycle de vente,
- et appliquez des tactiques d'optimisation du taux de conversion (CRO) basées sur des chiffres réels et non sur des intuitions.
Dans ce guide, nous explorerons les principaux critères, formules et tactiques qui vous aideront à augmenter les taux de conversion sur l'ensemble de votre entonnoir de vente B2B.
Quels sont les taux de conversion des entonnoirs de vente B2B ?
Il s'agit des pourcentages de prospects qui passent d'une étape à l'autre : par exemple, du visiteur au lead, au MQL, etc. jusqu'à ce que la transaction soit clôturée.
Plutôt que d'observer un « taux de conversion global », la véritable valeur réside dans le fait d'examiner chaque étape séparément.
Cela est particulièrement important pour les entreprises SaaS, les fournisseurs de services et les ventes B2B à cycle long où les métriques de l'entonnoir déterminent les principaux indicateurs de performance clés tels que le CAC, la taille moyenne des transactions ou la période de récupération.
Chaque étape marque un jalon clé pour l'acheteur, qu'il s'agisse de l'intérêt ou de l'intention d'achat :
- Une forte baisse du MQL au SQL peut indiquer une faible qualité du lead.
- Un faible taux d'opportunité de clôture peut entraîner des problèmes de tarification ou d'exécution des ventes.
En optimisant chaque étape de la conversion au lieu de se concentrer uniquement sur le sommet, le marketing et les ventes s'alignent, les frictions sont résolues et les performances des entonnoirs s'améliorent sans simplement augmenter le volume de prospects.
Quelles sont les étapes de l'entonnoir B2B ?
Découvrons comment chaque étape de l'entonnoir joue un rôle stratégique dans la transformation du trafic brut en revenus.
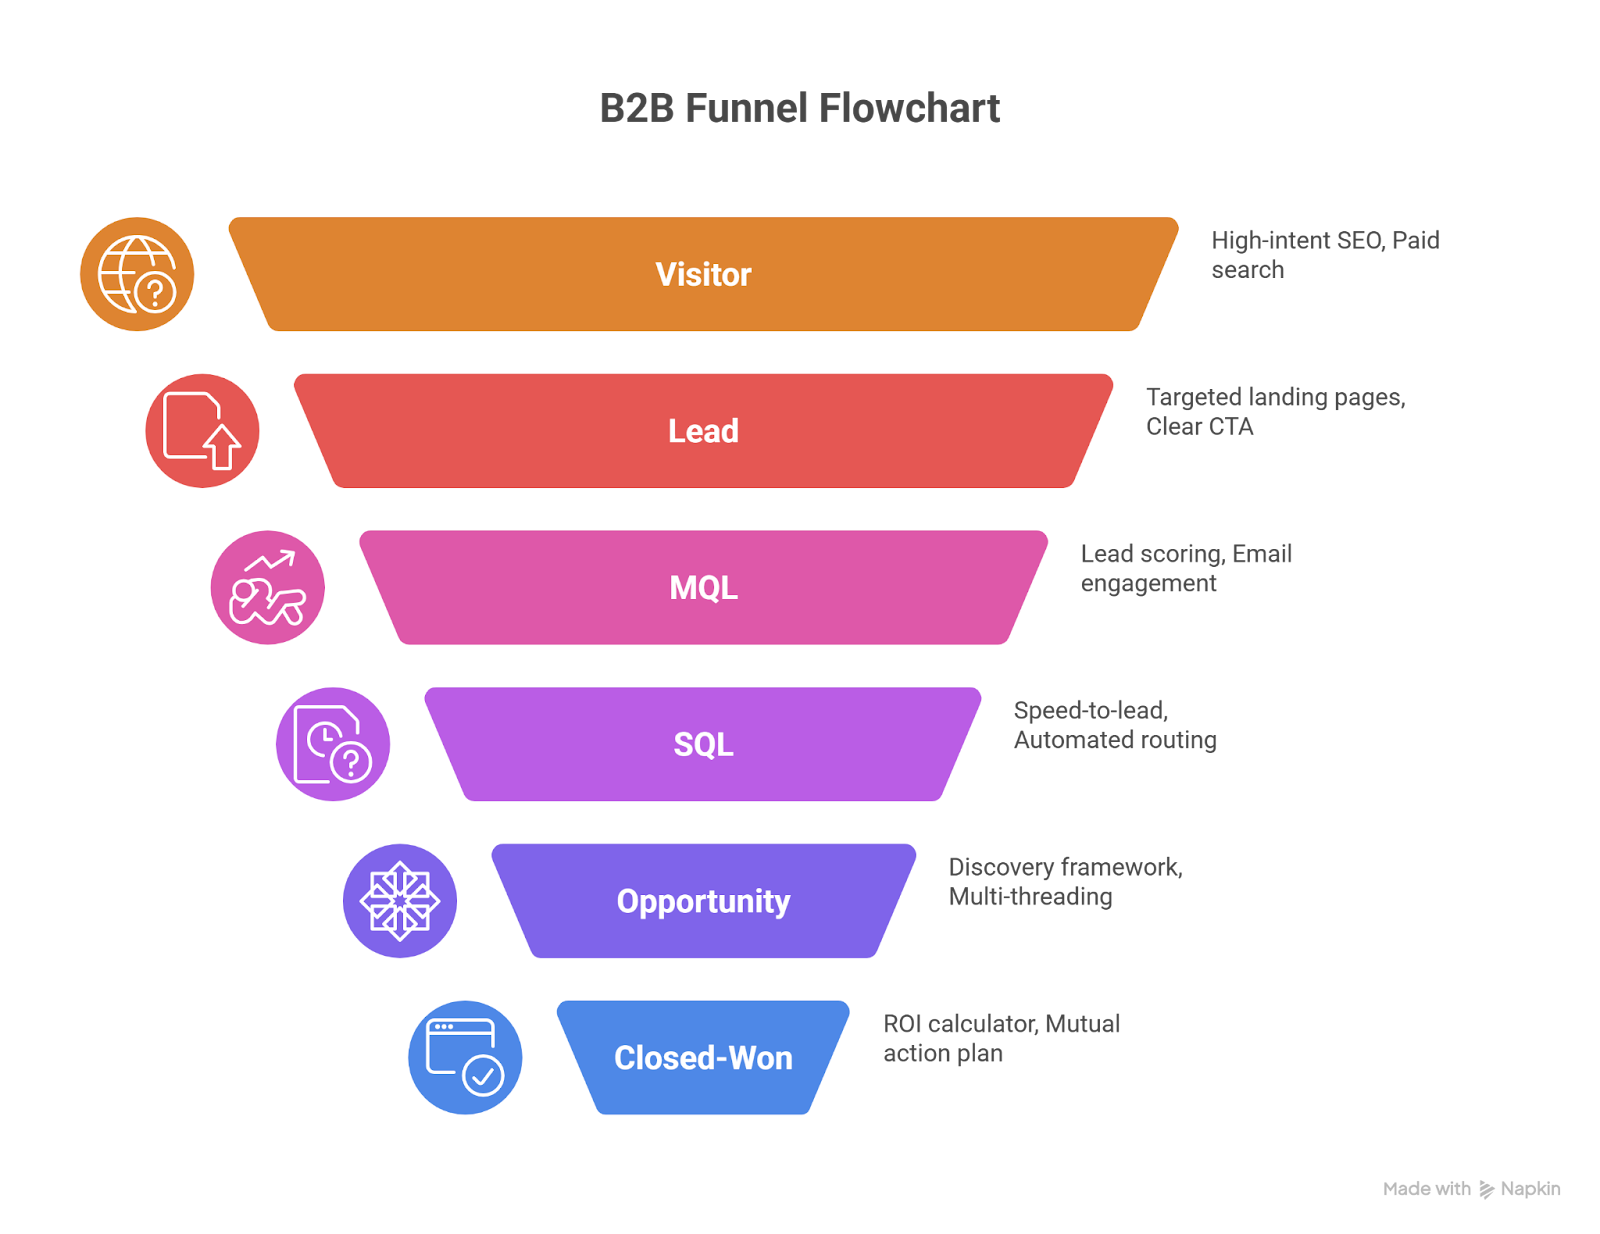
Sensibilisation → Visiteur
Au sommet de l'entonnoir B2B, vous attirez des acheteurs potentiels vers vos actifs numériques.
Les canaux incluent le référencement, la publicité payante, les réseaux sociaux, le co-marketing avec les partenaires et les recommandations. Les indicateurs clés incluent le CTR, le taux de rebond, la qualité des visites et les nouveaux utilisateurs par rapport aux anciens utilisateurs.
L'accent devrait être mis sur le trafic motivé par l'intention plutôt que sur le volume brut, car des visites de qualité permettent de réaliser des progrès significatifs.
Visiteur → Responsable (Formulaire/Inscription/Contact)
Ici, les visiteurs se présentent en remplissant un formulaire, en s'inscrivant pour un essai ou en demandant une démonstration.
Cette étape de conversion est très sensible à l'expérience utilisateur : des formulaires longs, un chargement lent ou une valeur peu claire peuvent tous stopper la dynamique. L'accent doit être mis sur des messages clairs, des signaux de confiance et des voies rapides.
Plomb → MQL
Toutes les pistes ne sont pas bonnes.
Les leads qualifiés en marketing (MQL) sont ceux qui vérifient les critères relatifs à la firmographie (taille de l'entreprise, secteur d'activité) et aux comportements (consultation de pages clés, interaction avec des e-mails importants).
Ce mélange d'adéquation et d'intention garantit que votre entonnoir est destiné à des prospects sérieux au lieu de se contenter de la circulation.
MQL → SQL
C'est là que les ventes entrent en jeu.
Les Sales Qualified Leads (SQL) répondent à vos critères d'acceptation prédéfinis : besoin clair, intérêt réel et autorité décisionnelle.
Un suivi rapide et constant est essentiel: des réponses lentes signifient souvent des occasions manquées.
SQL → Opportunité
Une opportunité signifie un prospect présentant des points faibles vérifiés, des décideurs impliqués et une trajectoire de valeur claire. Cette étape comprend des appels de découverte, des discussions sur les prix et des discussions sur la chronologie.
Votre travail : qualifiez et façonnez la transaction, ne le poussez pas trop vite.
Opportunité → Victoire clôturée
C'est la ligne d'arrivée.
L'acheteur s'engage. Pour y parvenir, fiez-vous à des preuves sociales (études de cas), à des modèles de retour sur investissement ou à des projets pilotes, et à des flux d'approvisionnement et juridiques clairs.
Les taux de victoire élevés dépendent de renforcer la confiance et éliminer les risques perçus.
Maintenance/extension (après la vente)
L'entonnoir ne s'arrête pas à la vente.
L'intégration, l'adoption des produits et l'assistance influencent votre potentiel de fidélisation et de ventes incitatives. Suivez le taux d'activation, l'utilisation des fonctionnalités et la rétention des recettes nettes (NRR).
Les clients satisfaits deviennent des témoignages, des recommandations et des offres d'expansion, alimentant la croissance future.
Qu'est-ce qui influe sur les taux de conversion des entonnoirs de vente ?
Plusieurs leviers influent sur les performances de votre entonnoir, mais le succès dépend de la manière dont vous harmonisez le timing, le ciblage et la confiance tout au long du parcours.
Qualité et intention du trafic
Si vous attirez le mauvais public, vos taux de conversion vont stagner avant même d'avoir commencé.
Des mots clés mal alignés, des canaux non pertinents ou des visiteurs peu intentionnés réduisent les conversions de visiteurs à prospects et augmentent le CAC.
Pour résoudre ce problème : ciblez des mots clés à forte intention, concevez des pages de destination en fonction de problèmes réels et adaptez les offres à la position des utilisateurs dans l'entonnoir.
Clarté et segmentation de l'ICP
Un ICP flou signifie que le marketing atteint ses objectifs de volume, mais que les ventes ont du mal à trouver la qualité.
Lorsque les MQL ne sont pas bien définies, vous créez une déconnexion, un nombre élevé de prospects et une faible acceptation commerciale. Segmentez plus précisément par firmographie (secteur, taille), par cas d'utilisation ou par éléments déclencheurs tels que la technologie ou l'étape commerciale.
Cette précision stimule la conversion MQL-SQL et aligne les deux équipes sur les bons prospects.
Rapidité de prise en charge et processus de suivi
La vitesse tue ou convertit. Répondre à un prospect dans les cinq minutes améliore considérablement les taux de connexion et de qualification.
Après 30 minutes, vos chances chutent fortement. Automatisez les alertes, appliquez les SLA et concevez des séquences de suivi par e-mail, téléphone et LinkedIn pour éviter la dégradation. Pour des raisons de pertinence et d'efficacité, le routage doit correspondre à l'expertise du représentant et au profil du responsable.
Stratégie d'offre et de prix
Votre offre influence la rapidité avec laquelle un prospect avance.
- Les essais longs et fermés ou le manque de clarté des prix sont souvent source de friction. Au lieu de cela, testez des offres telles que des démos non limitées, de courts essais ou des plans de démarrage clairs.
- N'exigez une carte de crédit que lorsque cela est justifié.
- Ajoutez des preuves sociales et des messages axés sur les résultats pour réduire les risques perçus et accélérer le cheminement dans l'entonnoir.
L'expérience du produit
Dans les mouvements de croissance pilotés par le produit, l'expérience produit constitue l'entonnoir.
Les bloqueurs d'activation, tels que la confusion dans l'expérience utilisateur ou l'absence d'intégration, retardent les conversions entre la version d'essai, PQL et SQL.
Concentrez-vous sur le court délai de rentabilisation:
- orientez rapidement les utilisateurs vers les principales fonctionnalités,
- mettre en évidence les victoires rapides,
- et obtenez rapidement des informations.
L'adoption des fonctionnalités et les déclencheurs d'utilisation sont des indicateurs clés pour la notation et le suivi des prospects.
Exécution des ventes
Les performances de l'entonnoir de vente à un stade avancé dépendent de la façon dont votre équipe commerciale gère le processus.
Une découverte solide, des prochaines étapes claires, un alignement des parties prenantes et un retour sur investissement crédible sont importants. Le multithread permet d'éviter les blocages liés à un seul thread.
Si vous perdez des offres en retard, le problème n'est peut-être pas lié au prix : il s'agit probablement d'un manque de clarté, d'urgence ou de preuves.
Contexte économique et complexité des transactions
Même un entonnoir parfait peut rencontrer des difficultés sur des marchés difficiles.
Les coupes budgétaires, la lenteur des achats et les formalités administratives peuvent prolonger les cycles ou annuler des transactions.
Dans ces cas, l'adaptabilité gagne : pilotes flexibles, messages axés sur la valeur et achats fluides aider à contrer la complexité. Équipez les ventes de packs d'approvisionnement et d'outils de retour sur investissement pour faire passer les offres.
À retenir : vous ne pouvez pas corriger la conversion dans l'entonnoir en ajoutant simplement des prospects. Vous l'améliorez en supprimant les frictions, en affinant le ciblage, en accélérant la réponse et en renforçant la valeur à chaque étape.
Comment calculer les taux de conversion en B2B ?
Avant de pouvoir optimiser votre entonnoir, vous devez le mesurer avec précision.
Formule de tarification par étapes
Aide aux taux de conversion par étapes mesurer l'efficacité avec laquelle les prospects passent d'une étape à l'autre.
La formule est simple :
Taux de conversion des étapes = (Compte au stade N+1/Compte au stade N) × 100
Par exemple, si 500 leads se transforment en 120 MQL, votre taux Lead to MQL est de (120/500) × 100 = 24 %.
Utilisez ce calcul pour chaque étape clé de votre entonnoir de vente B2B : Visiteur → Lead, Lead → MQL, MQL → SQL, SQL → Opportunité et Opportunité → Closed-Won.
Ces indicateurs d'entonnoir révèlent où se situent les goulots d'étranglement en matière de performances.
Mathématiques cumulées en entonnoir
Pour évaluer l'efficacité de votre entonnoir complet, du visiteur initial au client payant, multipliez le taux de conversion de chaque étape.
Exemple :
- Visiteur → Lead : 2,5 %
- Plomb → MQL : 30 %
- MQL → SQL : 40 %
- SQL → Opportunité : 60 %
- Opportunité → Victoire clôturée : 25 %
Taux de conversion global = 2,5 % × 30 % × 40 % × 60 % × 25 % = 0,45 %
Cela vous indique combien de visiteurs doivent entrer dans l'entonnoir pour générer un client payant (il s'agit d'un exemple mathématique simplifié : dans de véritables entonnoirs B2B, le taux de conversion global Visiteur → Client est souvent bien inférieur, comme le montrent les exemples ci-dessous.)
Même une légère amélioration du taux de conversion à chaque étape peut avoir un effet cumulatif important sur le chiffre d'affaires total.
Fenêtres horaires et cohortes
Utilisez toujours des délais cohérents lors du calcul des tarifs : par exemple, ne suivez que les prospects créés en janvier par rapport à leur progression dans le temps.
Le mélange de différentes cohortes peut fausser l'analyse.
Utilisez le suivi basé sur les cohortes pour tenir compte des différents cycles de vente :
- Les PME concluent leurs transactions plus rapidement que les grandes entreprises.
- Les performances des chaînes varient en fonction de la source et de l'intention du trafic.
- Les cohortes spécifiques à la campagne montrent une attribution plus claire.
Cette méthode permet d'éviter les fausses tendances et de garantir la précision de l'analyse en entonnoir.
Confiance et taille de l'échantillon
Ne vous fiez pas aux modifications des entonnoirs basées sur de petits ensembles de données. Attendez des échantillons statistiquement significatifs, généralement :
- 200 à 300 prospects par cohorte,
- 30 à 50 opportunités avant d'optimiser la stratégie.
Également,
- suivre les performances de l'entonnoir sur plusieurs périodes,
- recherchez des tendances répétables, et non des pics ponctuels.
Sinon, vous risquez de prendre des décisions sur la base d'une variance aléatoire.
Benchmarks de conversion des entonnoirs de vente B2B (aperçu)
Comprendre les performances de chaque étape de l'entonnoir B2B est clé pour améliorer les indicateurs globaux de l'entonnoir.
Vous trouverez ci-dessous un tableau de référence pour les entonnoirs de vente B2B typiques. Il s'agit de fourchettes éditoriales, vos valeurs réelles peuvent varier en fonction du modèle ICP, ACV, GTM et de la durée du cycle de vente.
Remarque : Utilisez-les comme points de référence et non comme cibles fixes.
Contexte par segment et taille moyenne des transactions (ACV)
- Entreprise/Valeur contractuelle annuelle élevée (ACV)
- Baisse des taux de démarrage en raison du resserrement des qualifications et de la longueur des cycles d'achat.
- Des performances plus élevées à un stade avancé une fois que l'intention est validée et que les parties prenantes s'alignent.
- PME/ETI
- Nombre de visiteurs → Lead et MQL → SQL plus élevés grâce à des cycles plus courts et à moins de friction.
- Baisse des taux de clôture en raison de la volatilité du budget et de l'augmentation du taux de désabonnement.
- Entonnoirs hybrides ou pilotés par le produit
- Incluez un stage PQL entre MQL et SQL.
- Une activation forte du produit améliore SQL → Opportunité et Opportunité → Fermer.
À retenir : Ces critères de conversion des entonnoirs B2B sont orientés et non des objectifs fixes. Concentrez-vous sur l'amélioration de vos propres performances au niveau de l'étape par rapport aux données passées avant de rechercher les « normes de l'industrie ».
Qu'est-ce qu'un bon taux de conversion pour le SaaS ?
Les critères de conversion SaaS varient considérablement : ce qui est « bon » dépend entièrement de votre stratégie, de votre modèle de tarification et de la manière dont les utilisateurs entrent dans votre entonnoir.
Par motion
Libre-service/Freemium
Les entreprises SaaS utilisant un modèle axé sur les produits enregistrent généralement un taux de conversion élevé du nombre de visiteurs → inscriptions grâce à une faible friction et à un accès instantané.
Cependant, Trial → Paid est souvent en retard à moins que le taux d'activation ne soit géré de manière rigoureuse. Sans une intégration solide et une réalisation rapide de la valeur, de nombreux utilisateurs abandonnent avant de convertir.
Dirigé par les ventes
Les entonnoirs axés sur les ventes attirent moins de prospects mais des prospects plus qualifiés.
Grâce à des démonstrations personnalisées, à des appels de découverte et à un processus de vente clair, la conversion SQL → Closed-Won est généralement plus efficace. Ce modèle s'appuie sur des DTS et des EA compétents qui peuvent identifier les points faibles, élaborer des analyses de rentabilisation et conclure des transactions de grande valeur.
Croissance hybride axée sur les produits (PLG) + Croissance axée sur les ventes (SLG)
La combinaison des deux modèles peut permettre d'obtenir les meilleurs résultats.
Les flux en libre-service attirent des utilisateurs à titre d'essai, tandis que les équipes commerciales convertissent les comptes à fort potentiel grâce à des ventes consultatives et à un engagement plus approfondi.
Par offre
- Outils simples avec paiement initial par carte de crédit : essai de 20 à 30 % → Payé. Ces flux bénéficient du filtrage immédiat des utilisateurs les plus intentionnés.
- Outils complexes, pas de carte de crédit : essai de 5 à 15 % → Payé. Ces inscriptions sont plus faciles à obtenir mais plus difficiles à convertir sans intégration active.
Les tactiques à améliorer incluent l'intégration intégrée à l'application, les listes de contrôle d'utilisation, les e-mails déclenchés et l'envoi d'un moment « ah » à l'avance.
Par tranche de prix
- Moins de 5 000$ ACV : Taux de conversion élevé au stade initial (visiteur → prospect ou inscription), mais baisse du nombre de transactions conclues en raison de contraintes budgétaires ou d'un taux de désabonnement. Fonctionne mieux dans les entonnoirs à volume réduit et à faible contact.
- 5 000 à 50 000 dollars ACV : Des performances équilibrées sur l'ensemble du funnel avec des cycles modérés et de multiples parties prenantes. La découverte et la qualification sont essentielles à cet égard.
- 50 000$ et plus d'ACV : Plus lent en haut mais plus fort en bas. Les transactions d'entreprise se transforment bien une fois que vous y êtes parvenue, grâce à la preuve de la valeur, aux projets pilotes et à l'alignement sur les objectifs stratégiques.
Il n'existe pas de « bon » taux de conversion SaaS universel. Il s'agit de vous aligner sur votre mouvement de commercialisation, votre stratégie de prix et les intentions des utilisateurs, et d'améliorer constamment vos propres bases de référence grâce à des expérimentations ciblées.
Quels sont les points de référence du secteur en matière de taux de conversion ?
Les taux de conversion varient considérablement d'un secteur à l'autre, en fonction de la complexité de l'offre, de l'intention de l'acheteur et de la structure de l'entonnoir, du premier contact à la conclusion de la transaction.
SaaS, services et matériel
Le SaaS (en particulier le B2B) est généralement plus performant en haut de l'entonnoir.
- Les taux de visiteurs → prospects typiques se situent autour de 2 à 3 % dans de nombreux modèles SaaS, ce qui est supérieur à la moyenne B2B générale de 0,8 à 2,5 %.
- La conversion d'essai ou de freemium en version payante varie généralement de 5 à 20 %, selon la friction et la qualité de l'activation.
Motions en libre-service stimulent souvent les conversions précoces, mais les SaaS à ACV élevé peuvent connaître une baisse plus tard sans une forte implication des ventes.
Services B2B et sociétés de conseil constatent généralement une baisse du taux de conversion du site Web en raison des visiteurs inactifs (souvent 2 à 3 % ou moins). Les cycles de vente impliquent un plus grand nombre de décideurs, ce qui ralentit la progression du mode Opportunity au statut Close‑Won par rapport au mode SaaS.
Matériel, IoT ou grands CapEx B2B fait face à des achats et à une validation technique plus importants. Le taux de conversion en entonnoir anticipé est généralement plus faible en raison des besoins en matière d'enseignement supérieur. Une fois qu'une transaction est qualifiée, la conversion à un stade avancé peut s'améliorer, mais les cycles sont longs et le risque de fuite est élevé.
Plus la solution est complexe et onéreuse, plus les conversions anticipées sont faibles et plus il y a de frictions à chaque étape (approvisionnement, budget, aspects juridiques, approbations).
Benchmarks des chaînes
Le référencement, les sites d'évaluation et la recherche organique ont tendance à améliorer la qualité et la conversion du MQL plutôt que des publicités à affichage large ou du trafic payant générique.
Par exemple, Visiteur → Lead à 2,10 % via le référencement naturel contre 0,70 % via le PPC.
Le retargeting permet d'augmenter les conversions en milieu de parcours en réengageant les visiteurs qui ont déjà manifesté leur intention. Les canaux qui indiquent une intention d'achat plus élevée (tels que les webinaires, les téléchargements de listes de contrôle ou les recommandations de sites d'évaluation) enregistrent de meilleurs taux de conversion en aval.
La recherche payante pour la génération de prospects B2B génère en moyenne un taux de conversion d'environ 2,7 % dans tous les secteurs (selon Belkins.io), variant de manière significative en fonction de la force de l'offre et du niveau d'intention.
Effets sur la taille de l'entreprise
Les startups, les entreprises axées sur les PME ou les entreprises ciblant un ICP de niche restreint enregistrent souvent des taux Lead → MQL et MQL → SQL plus élevés car moins de parties prenantes sont impliquées et les décisions sont prises plus rapidement.
Les fournisseurs d'entreprise et les fournisseurs à ACV élevé sont généralement confrontés à des taux de visiteurs → prospects et prospects → MQL inférieurs en raison de filtres ICP stricts et de qualifications plus strictes.
Cependant, une fois qu'une transaction commerciale devient une véritable opportunité, les taux des entreprises à un stade avancé s'améliorent souvent. De nombreuses entreprises industrielles ou manufacturières convertissent moins de 1 % du trafic en haut de l'entonnoir (selon Première page Sage).
Saisonnalité et cycle
Les taux de conversion fluctuent en fonction des cycles financiers. Le quatrième trimestre ralentit souvent les achats en raison du gel des budgets, et les prospects générés à la fin du trimestre peuvent passer à la période suivante. Les calendriers fiscaux et les jours fériés régionaux influencent également le calendrier des transactions.
Les transactions plus complexes prennent plus de temps.
Comment améliorer les taux de conversion de l'entonnoir de vente
Améliorer la conversion en entonnoir consiste à corriger les bons goulots d'étranglement à chaque étape en termes de données, d'intention et de rapidité.
Optimisez « Visiteur » → « Lead »
Commencez par l'intention : de nombreux entonnoirs B2B sont moins performants en haut de la liste car le trafic ne correspond pas à l'intention de l'acheteur.
Associez vos termes de recherche et vos campagnes publicitaires à des mots clés à forte intention, éliminez les termes généraux et mal alignés et concentrez-vous sur les actifs qui répondent directement aux problèmes.
Ensuite, corrigez votre expérience d'atterrissage. La vitesse est importante. Il en va de même pour la clarté.
Utilisez un seul CTA, simplifiez les formulaires (personne n'a besoin de sept champs obligatoires à l'avance) et placez les signaux de confiance (logos, devis clients, badges partenaires) au-dessus du pli. Le profilage progressif permet de recueillir plus de données ultérieurement.
Améliorez « Lead » → « MQL »
Arrêtez de compter tous ceux qui téléchargent un livre blanc parmi les prospects qualifiés.
Élaborez un modèle de notation qui combine des firmographies (taille de l'entreprise, secteur d'activité, technologie) avec le comportement d'achat réel (pages de tarification, participation à des webinaires, sessions répétées). Éliminez les étudiants, les agences et les faux e-mails.
Sur le plan nutritionnel, abandonnez les gouttes génériques. Déclenchez du contenu par cas d'utilisation ou par personnage. Proposez des calculateurs de retour sur investissement aux directeurs financiers et des feuilles de route des produits aux vice-présidents de l'ingénierie. Laissez-vous guider par vos e-mails, pas seulement harceler.
Soulevez « MQL » → « SQL »
Les prospects contactés dans les 5 minutes ont beaucoup plus de chances d'être convertis. Configurez des alertes, automatisez les transferts et intégrez des calendriers à vos pages de remerciement pour réserver des réunions immédiatement.
Formez les représentants à diriger en tenant compte du contexte. Le message de première contact doit être lié à ce que le prospect a fait (par exemple, « Vous avez téléchargé notre rapport de référence GTM : vous êtes curieux de savoir ce qui s'est démarqué ? »).
Utilisez des cadres de qualification simples et ne répercutez que de vrais acheteurs.
Augmentez « SQL » → « Opportunité »
C'est là que la découverte fait ou défait votre pipeline. Les représentants doivent surmonter les difficultés superficielles pour découvrir l'impact commercial et s'aligner sur les critères de réussite. Assurez-vous de répertorier toutes les parties prenantes et de confirmer rapidement les délais d'achat.
Pour réduire les risques, partagez des études de cas pertinentes, proposez des calculateurs de retour sur investissement adaptés au cas d'utilisation du prospect et présentez les dirigeants ou les homologues techniques en cas de besoin.
Le multithreading n'est pas facultatif, c'est la façon dont les gros contrats sont réalisés.
Augmentez « Opportunité » → « Victoire fermée »
La friction tue les transactions en retard. Réduisez-le en étant proactif.
Fournissez rapidement les documents relatifs à la sécurité et à l'approvisionnement, expliquez clairement vos niveaux de tarification et proposez des POC ou des projets pilotes avec des étapes de réussite claires.
Testez les modèles de tarification (par siège, en fonction de l'utilisation ou échelonnés) pour voir ce qui vous convient. Évitez les remises inutiles en créant de la valeur dès le début et en utilisant la preuve sociale de manière cohérente tout au long du cycle des transactions.
Accélérez l'activation et la rétention
Bouclez la boucle grâce à l'intégration après-vente.
Identifiez le moment de la « première valeur » (quelle action prédit la rétention) et concevez l'intégration de manière à ce qu'il soit atteint rapidement. Utilisez les conseils intégrés à l'application, les alertes d'utilisation et les incitations amicales pour vous aider.
Suivez qui utilise quoi et à quelle fréquence. Si une fonctionnalité est sous-utilisée, demandez-vous pourquoi. Si une équipe est silencieuse, enregistrez-vous.
Une intégration réussie favorise la rétention, l'expansion et les recommandations (souvent mieux que n'importe quelle campagne publicitaire).
Gouvernance du programme CRO
Traitez l'optimisation de l'entonnoir comme le développement de produits.
Gardez un arriéré d'hypothèses, établissez les priorités par impact et par effort, et exécutez des tests A/B avec des tailles d'échantillons disciplinées. Ne modifiez pas trois variables à la fois.
Plus important encore, créez une boucle de feedback entre le marketing, les ventes, les produits et le CS. Les analyses hebdomadaires peuvent rapidement faire apparaître les problèmes (et vous aider à les corriger avant la fin du trimestre suivant).
Benchmarks de conversion SaaS par étape (analyse approfondie)
Par motion
- Libre‑service/Freemium: Ces modèles enregistrent souvent un taux de conversion Visiteur → Inscription plus élevé en raison de la faible friction d'accès. Cependant, la version d'essai → Payed baisse si l'intégration est faible ou si la valeur n'est pas immédiatement claire.
- Dirigé par les ventes: Attendez-vous à des taux de visiteurs → prospects plus faibles (plus de contrôle), mais à des conversions SQL → Close plus élevées grâce à des démonstrations personnalisées et à un engagement commercial rapproché.
- Hybride (PLG + SLG): La combinaison de l'entrée en libre-service et d'une vente incitative assistée par la vente permet souvent d'obtenir les meilleures performances sur l'ensemble du funnel.
Par offre
- Version d'essai pour payer pour des outils simples: 20 à 30 % lorsqu'une carte de crédit est requise à l'avance.
- Produits d'entreprise complexes sans exigence de CC: 5 à 15 % en général.
- Principaux leviers: déclenchez le « moment décisif », alignez les prix sur le retour sur investissement perçu et testez les prix et les essais de manière agressive.
Par tranche de prix
- Moins de 5 000$ ACV : Des cycles de vente plus courts, moins de parties prenantes ; plus de conversions au stade initial, mais une baisse du nombre de contrats clôturés gagnés en raison du taux de désabonnement et des transactions plus petites.
- 5 000 À 50 000 DOLLARS PLUS : Des performances équilibrées dans l'entonnoir ; la véritable qualification est importante, le mouvement au milieu de l'entonnoir est essentiel.
- 50 000$ ET PLUS, TVA : Moins de prospects initiaux, mais une forte conversion à un stade avancé une fois les offres validées ; les cycles de vente sont longs et multifilaires.
Points de référence par étape
- Visiteur → Inscription : Moyenne de 1 à 3 % ; exceptionnel de 4 à 8 %.
- Inscription → Activation (dans les 7 jours) : Moyenne de 25 à 45 % ; exceptionnel de 50 à 70 %.
- Version d'essai → Payé : Moyenne de 8 à 20 % ; exceptionnel de 25 à 40 %.
- SQL → Fermer : En moyenne de 20 à 30 % ; exceptionnel de 35 à 50 %.
Qu'est-ce qui fait bouger l'aiguille ?
- Indications relatives au produit : Clarifiez la valeur dès le début, déclencheurs d'utilisation, configuration personnalisée.
- Messagerie : Des articles axés sur les résultats (par exemple, le temps gagné, les revenus gagnés), et non des listes de fonctionnalités.
- Méthodologie de vente : Cadres de vente à valeur ajoutée, engagement simultané des parties prenantes, clarté quant aux prochaines étapes.
- Tests de tarification : L'utilisation par rapport au siège par rapport à la tarification échelonnée, des offres transparentes, des incitations basées sur des déclencheurs plutôt que des remises générales.
Les taux de conversion élevés sont le résultat d'une excellence constante à chaque étape.
L'effet cumulatif de l'optimisation de l'intention du trafic, de la valeur du produit, du processus de vente et de la tarification est ce qui distingue la moyenne de l'exceptionnel.
Exemples de calcul des taux de conversion B2B
Exemple 1 : SaaS axé sur le contenu
Imaginez un produit commercialisé principalement via du contenu entrant :
- Visiteurs : 100 000 → Prospects : 1 500 (Visiteur → Lead = 1,5 %)
- Prospects → MQL : 450 (30 %)
- MQL → SQL : 135 (30 %)
- SQL → Opportunités : 61 (45 %)
- Opportunités → Gagné à huis clos : 18 (30 %)
Le taux global Visiteur → Client est donc de 18/100 000 = 0,018 %.
Pourquoi c'est important : avec ce rendement, augmenter le nombre de visiteurs → prospects de 1,5 % à 2,0 % pourrait générer 500 prospects supplémentaires et potentiellement 6 clients supplémentaires (le tout sans dépenses de trafic supplémentaires).
Dans de nombreux cas, le fait de renforcer MQL → SQL ou SQL → Opp a un effet plus important sur le CAC et le retour sur investissement que de consacrer davantage d'efforts au sommet.
Exemple 2 : entreprise dirigée par les ventes
Considérons maintenant un modèle à cycle long à ACV élevé :
- Visiteurs : 50 000 → Prospects : 400 (0,8 %)
- Prospects → MQL : 120 (30 %)
- MQL → SQL : 36 (30 %)
- SQL → Opportunités : 18 ans (50 %)
- Opportunités → Gagné à huis clos : 6 (33 %)
Conversion globale : 6/50 000 = 0,012 %.
Malgré les faibles taux initiaux, le retour sur investissement peut tout de même être intéressant, car le vinaigre de cidre de pomme peut se situer entre 80 000 et 250 000 dollars et plus.
Ici, l'accent est mis sur la qualité des découvertes, la cartographie des parties prenantes et les transactions multifilaires (et non pas uniquement sur le volume). Les rapports de cohorte sont également essentiels, car la durée des cycles de 6 à 18 mois signifie que vous ne pouvez pas évaluer les performances d'un mois à l'autre.
Avertissements relatifs à l'attribution
Attention aux pièges : de nombreux acheteurs utilisent plusieurs touches (webinaire → annonce → LinkedIn → démo).
Le double comptage des pistes ou la combinaison de fenêtres de cohorte peuvent donner des résultats trompeurs.
Utilisez judicieusement le premier contact et le dernier contact, mais choisissez un modèle principal (en forme de W ou basé sur la position) pour une prise de décision cohérente. Les vues de cohorte, par mois d'acquisition, par canal ou par campagne, évitent le bruit et garantissent la fiabilité de vos calculs de conversion.
Ce qu'il faut retenir : De faibles pourcentages d'amélioration à chaque étape s'aggravent considérablement. En calculant les taux par étapes et en analysant les cohortes, vous obtenez les informations nécessaires pour investir de manière plus intelligente et générer de meilleurs revenus (plutôt que de vous contenter de statistiques personnalisées).
Quels indicateurs suivre au-delà des taux de conversion ?
La véritable croissance provient du suivi des facteurs qui stimulent la rapidité, la qualité et la valeur à long terme dans l'ensemble de votre entonnoir.
Vitesse et temps de mise en scène
Suivez le nombre médian de jours par étape pour repérer les goulots d'étranglement et utilisez les alertes de vieillissement pour signaler les offres bloquées. La vitesse compte autant que la progression.
Indicateurs de qualité
Mesurez la valeur des opportunités, la précision des prévisions et les raisons des victoires/défaites. Les fuites de phases et les notes CRM fournissent un contexte critique pour les écarts de conversion.
Métriques d'efficacité
Surveillez le CAC, la durée du cycle de vente, la capacité de vente, le coût par opportunité et la période d'amortissement. L'efficacité de la croissance ne dépend pas uniquement du volume.
Indicateurs d'adoption des produits
Suivez les taux d'activation, l'utilisation des fonctionnalités, le Net Promoter Score, le score de satisfaction client et les mesures de fidélisation et d'extension. Un taux de conversion élevé n'a de sens que s'il génère une valeur réelle et durable.
Comment aligner le marketing et les ventes autour des définitions des étapes ?
Glossaire partagé
Codéfinissez Lead, MQL, SQL, Opportunity et Closed-Won avec des critères clairs. Documentez la propriété, les actions et les SLA dans un playbook partagé.
Bilan trimestriel
Réalisez des révisions conjointes pour recalibrer les seuils de notation, la logique de routage et les SLA. Alignez les champs CRM et MAP pour assurer la cohérence des rapports entre les équipes.
Quels sont les pièges courants à éviter en matière d'entonnoir ?
- Considérer les prospects bruts comme un succès : Le fait de se concentrer sur le volume de plomb sans ajustement ICP permet de dépasser les DTS et de gonfler les chiffres MQL sans véritable valeur du pipeline.
- Fuite de stade : Les leads recyclés non suivis ou les SQL bloqués faussent les métriques. Définissez des règles de recyclage et de fermeture des déchets pour que l'entonnoir reste propre et que les prévisions soient précises.
- Dépendance excessive au dernier clic : La surévaluation des derniers clics payants mine le référencement et le contenu qui génèrent une demande intentionnelle élevée. Équilibrez les gains à court terme avec la stratégie à long terme
- Offre d'entrée mal alignée : Proposer des essais pour des ventes complexes ou des démonstrations pour des produits simples nuit à la conversion. Adaptez le format à l'acheteur et à l'adéquation du produit.
- Négliger l'intégration : Le fait d'investir du budget dans l'acquisition sans régler le problème de l'intégration augmente le taux de désabonnement et le CAC. Activez avant la mise à l'échelle.
Playbooks pour améliorer des étapes spécifiques (prêts à être copiés)
Utilisez ces mini-playbooks pratiques pour résoudre les problèmes et augmenter les conversions là où cela compte le plus. Chacun cible une étape de l'entonnoir spécifique avec des tactiques testées et répétables.
Visiteur → Responsable : CRO Checklist
Objectif: optimisez les conversions entre le trafic et les soumissions de formulaires.
- Faites correspondre le titre et le CTA à l'intention de recherche
- Afficher la preuve sociale au-dessus de la ligne de classement (logos, statistiques, signaux de confiance)
- Limitez les formulaires à 2 à 4 champs essentiels
- Ajoutez une garantie de confidentialité sous le formulaire
- Assurez-vous que les pages se chargent en moins de 2 secondes
Lead → MQL : actualisation du système de notation
Objectif: Identifiez les prospects les plus potentiels avec une meilleure précision.
- Priorisez les prospects par secteur d'activité, taille de l'entreprise et technologie
- Augmentez le score pour les actions les plus intentionnelles (affichage des prix, ouverture d'e-mails)
- Exclure les étudiants, les agences ou les personnes non pertinentes
- Configurer une logique de décroissance pour les prospects inactifs ou âgés
MQL → SQL : tactiques visant à accélérer le processus
Objectif: Réagissez rapidement pour maintenir l'intérêt et vous qualifier efficacement.
- Attribuez automatiquement des prospects aux représentants dès qu'ils se qualifient
- Déclenchez un e-mail instantané avec lien de calendrier intégré
- Lancez une séquence de suivi à 3 touches dans les 48 heures
- Intégrez les options de réservation de réunions sur les pages de remerciement
SQL → Opportunité : Discovery Deep Dive
Objectif: Validez l'adéquation et élaborez une analyse de rentabilisation convaincante.
- Exécutez des appels en utilisant Problème → Impact → Structure de valeur
- Identifier toutes les parties prenantes dès le début du processus
- Confirmez le calendrier d'achat et définissez les prochaines étapes en direct
Opportunité → Clôture : Kit d'accélération des transactions
Objectif: Réduisez les risques liés à l'étape finale et accélérez la prise de décisions.
- Partagez un plan d'action mutuel avec des jalons
- Utilisez un calculateur de retour sur investissement personnalisé adapté aux problèmes
- Fournir une documentation de sécurité/informatique de manière proactive
- Proposez des appels de référence et faites appel à des sponsors exécutifs
Cadence et visualisation des rapports
Tableau de bord hebdomadaire
- Suivez les taux de conversion étape par étape par canal, secteur d'activité et taille de l'entreprise.
- Incluez la vitesse (temps passé dans la phase) et signalez les fuites pour guider les prises debout.
Tableau de cohorte mensuel
- Graphiez les cohortes d'essai par mois d'inscription : activation 7 jours, 14 jours sur 30 jours, période d'essai → version payante et taux d'extension.
- Utilisez des cartes thermiques pour visualiser les dépôts et créer un lien vers l'intégration ou la source de contenu.
Bilan trimestriel
- Comparez les indices de référence du funnel par rapport au trimestre précédent ; mettez en évidence les expériences qui ont fait évoluer un taux d'au moins 10 % (par exemple, nouvel e-mail d'intégration, intégration d'un calendrier).
- Ajustez la notation, le routage et les SLA. Alignez les équipes autour de nouvelles hypothèses et priorités.
Outillage pour mesurer et optimiser
Analyses et CRO
- Utilisez l'analyse Web et l'analyse des produits pour suivre le comportement des visiteurs → des prospects et des essais → des paiements.
- Effectuez des tests A/B sur les pages de destination, l'intégration et la tarification pour relever les étapes clés.
RevOps
- Le CRM doit refléter les définitions d'étapes et les statuts du cycle de vie partagés.
- Automatisez le routage et le suivi des prospects.
- Utilisez des tableaux de bord BI pour suivre les performances du CAC, de la vélocité et de l'entonnoir par ICP.
Produit
- Les guides, listes de contrôle et info-bulles intégrés à l'application facilitent l'activation.
- Suivez les événements clés et utilisez des widgets de feedback ou le NPS pour détecter rapidement les frictions.
Alignement des données
- Standardisez les définitions dans les domaines du CRM, du MAP et de l'analytique.
- Utilisez un dictionnaire de données partagé pour éviter de signaler des incohérences.
Conclusion
L'amélioration des taux de conversion des entonnoirs de vente B2B n'est pas une question de conjectures : il s'agit de points de référence précis, d'équipes alignées et d'une optimisation basée sur les données à chaque étape. Du visiteur au client payant, chaque point de pourcentage gagné contribue à la croissance de vos revenus.
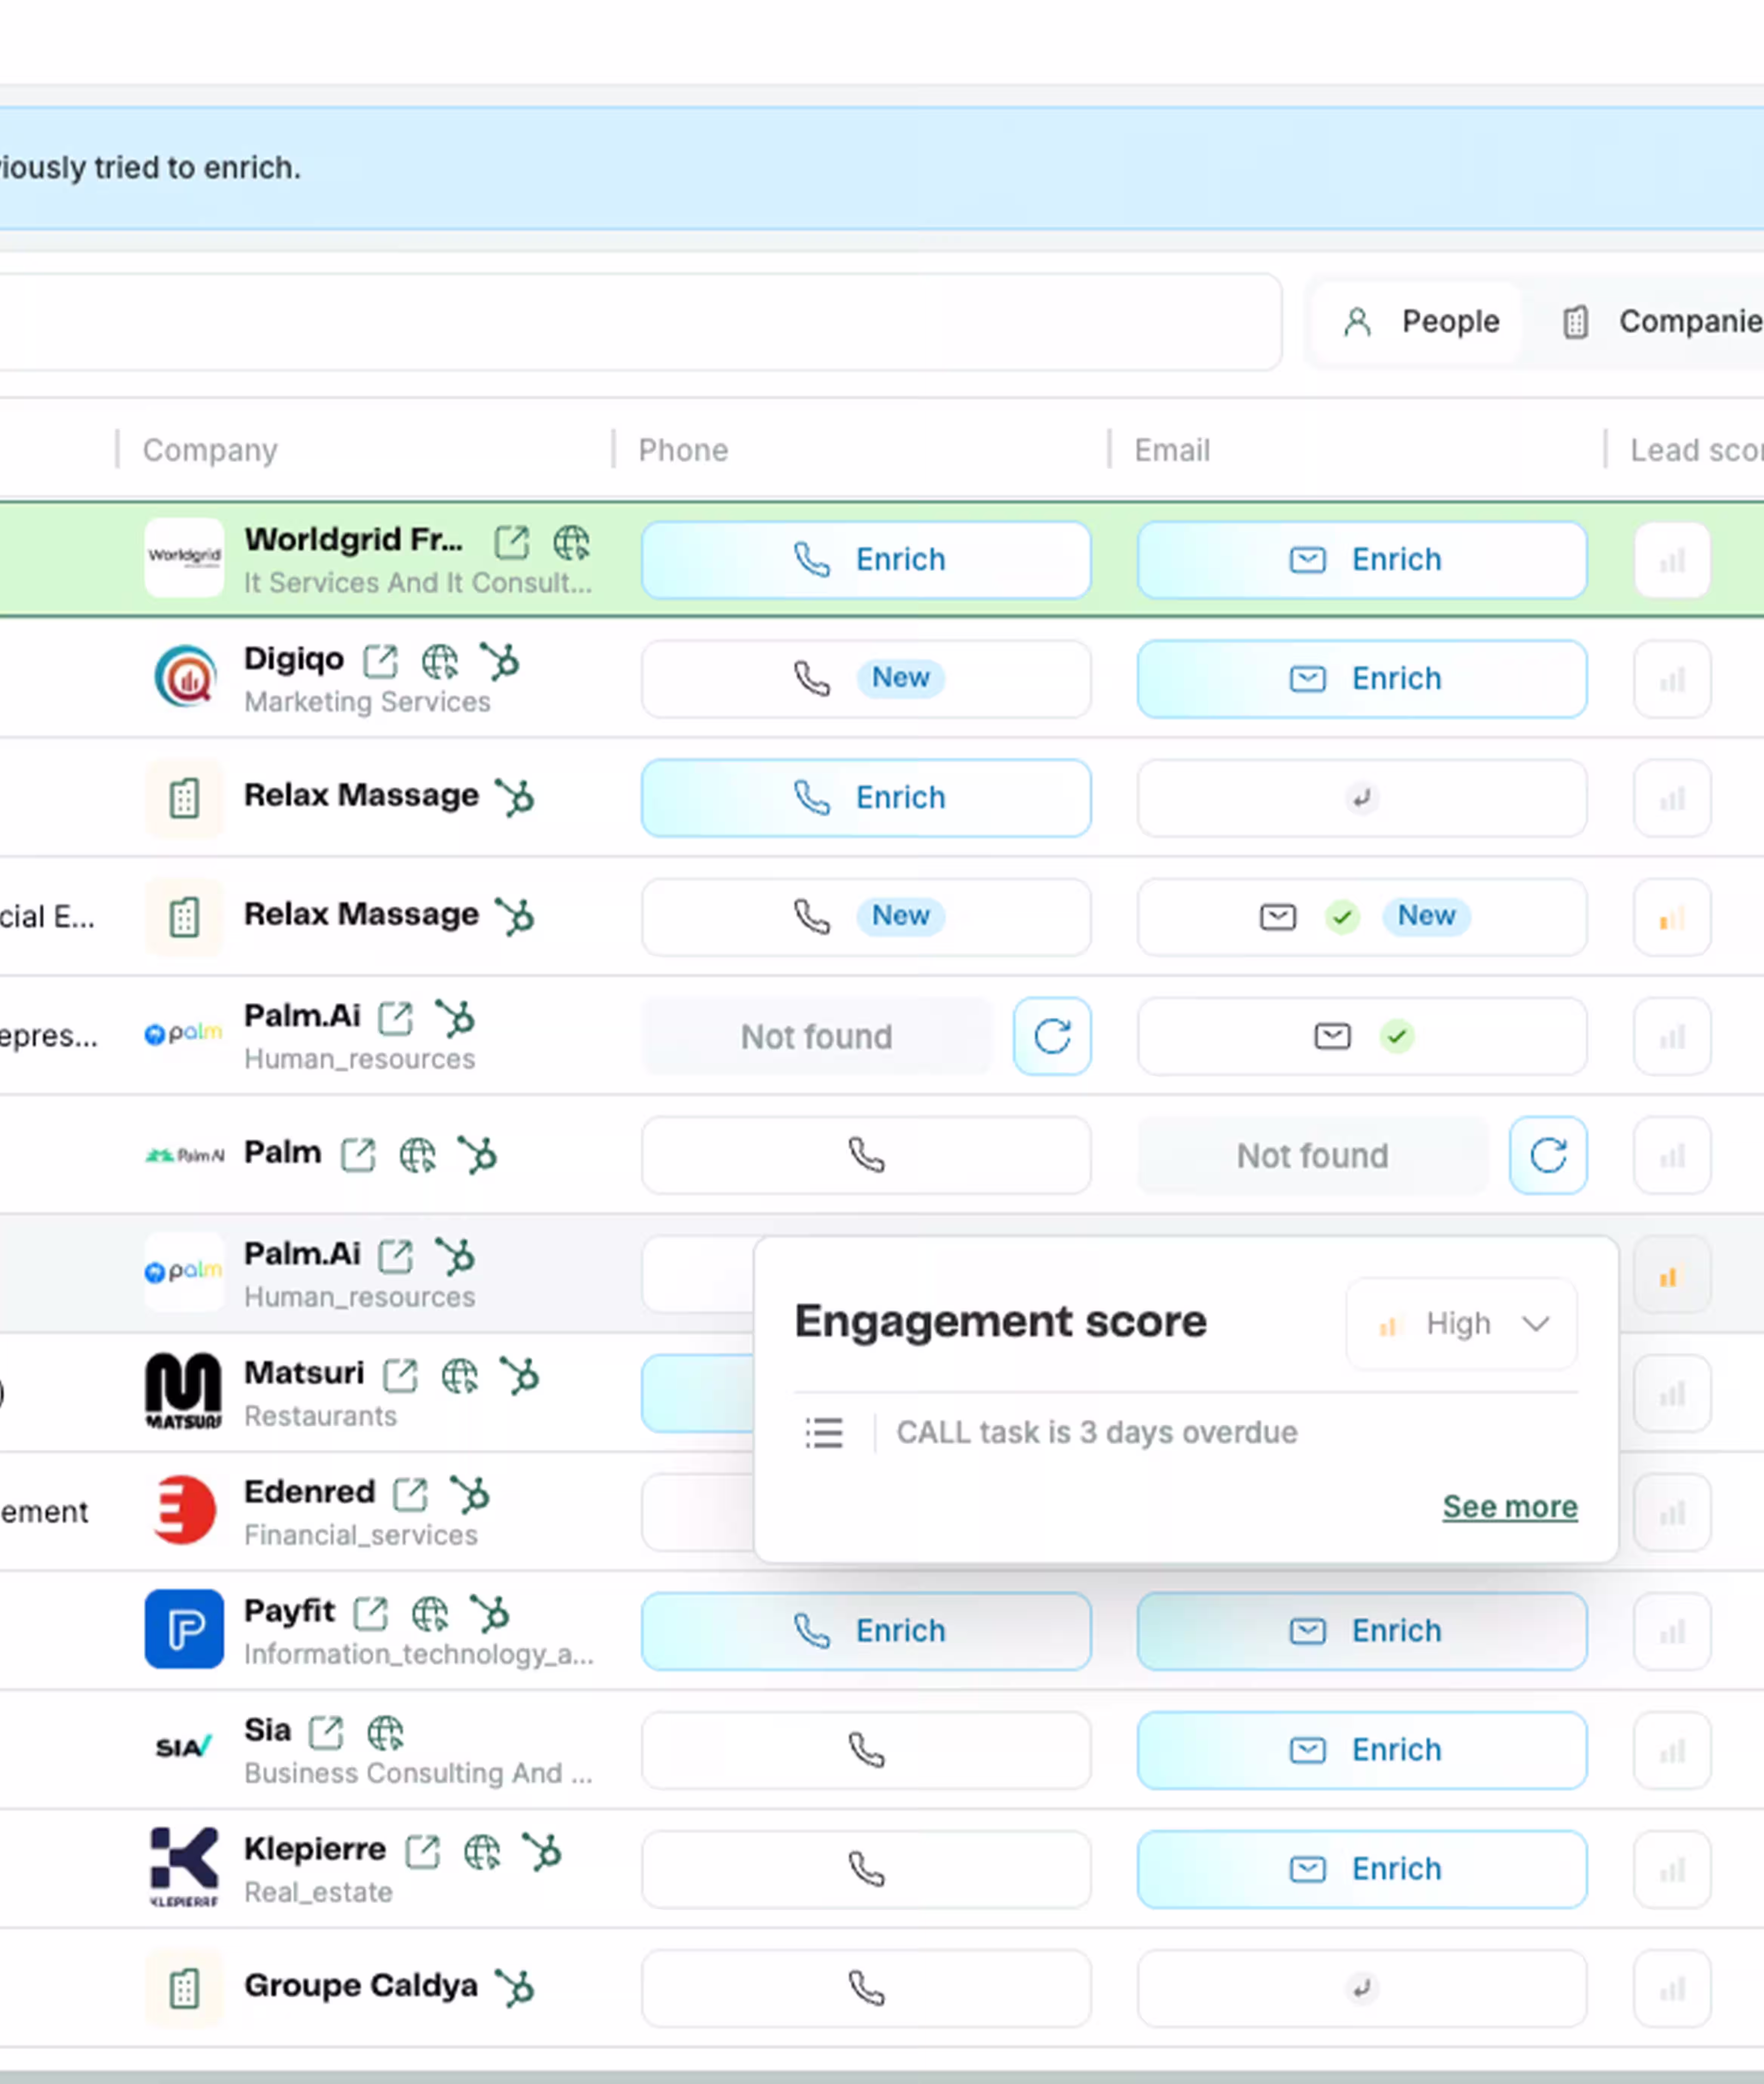
ZELIQ vous aide à agir rapidement sur la base de ces informations : grâce à une prospection unifiée, à une visibilité en temps réel sur l'entonnoir et à une sensibilisation automatisée qui stimule les conversions.
Êtes-vous prêt à identifier les maillons faibles et à transformer votre entonnoir en moteur de revenus ? Commencez votre essai gratuit de ZELIQ dès aujourd'hui et transformez la façon dont votre marketing et vos ventes convertissent.
Enter the future of lead gen
Table of contents
Placeholder Title
Table of contents
Placeholder Title
Placeholder Title