

Les équipes B2B gagnent lorsque les calculs du taux de conversion sont visibles, partagés et liés à l'action. Cet article vous propose un rapport de référence pragmatique que vous pouvez utiliser dès aujourd'hui. Vous y trouverez des définitions des étapes, des fourchettes de taux de conversion moyens par secteur d'activité, deux exemples d'entonnoirs fonctionnels et des listes de contrôle tactiques qui aident une équipe commerciale à améliorer ses performances sans conjectures. Les conseils sont basés sur des mouvements B2B courants dans tous les secteurs, des entreprises SaaS aux entreprises industrielles en passant par le commerce électronique et les services professionnels. L'accent est mis sur la clarté, des pratiques reproductibles et un transfert transparent entre les ventes et le marketing.
Quel est le taux de conversion moyen par secteur d'activité ?
Avant de comparer des entreprises, alignez-vous sur une définition. Un taux de conversion est le pourcentage d'utilisateurs ayant effectué une action souhaitée. En B2B, vous suivez de nombreuses conversions tout au long de l'entonnoir de vente, pas un seul chiffre. Vous mesurez le nombre de visiteurs par rapport à un prospect, un lead par rapport à MQL, un MQL par rapport à SQL, un SQL par rapport à une opportunité et une opportunité par rapport à un gain de clôture. Vous pouvez également suivre la période d'essai jusqu'à l'activation et la version d'essai jusqu'à la version payante des requêtes SaaS B2B.
Voici une grille éditoriale qui illustre les fourchettes moyennes auxquelles vous pouvez vous attendre. Traitez-les comme des bandes d'orientation pour commencer votre analyse. Ajustez en fonction du secteur d'activité, de la taille de la transaction et de la durée du cycle de vente.
Pourquoi le taux par secteur d'activité peut-il varier ?
Vous constaterez des différences selon l'ACV et le nombre de parties prenantes au sein du comité d'achat. Les transactions d'entreprise indiquent des taux de démarrage plus bas et des taux plus élevés de stade avancé une fois que plusieurs décideurs s'alignent. Les mouvements des PME indiquent des taux de démarrage plus élevés et des taux de clôture plus faibles. L'expérience utilisateur sur votre site et dans votre produit influe également sur le taux d'adoption et de rétention. Une activation plus rapide augmente le retour sur investissement et améliore les calculs de conversion en aval.
Utilisez les points ci-dessous pour ancrer votre définition et éviter toute confusion lors du signalement :
- Action souhaitée doit être explicite : une demande de démonstration n'est pas la même chose qu'une inscription à une newsletter.
- Dénominateurs doit être clair : mener à MQL utilise des pistes comme étape préalable.
- Fenêtre horaire important : utilisez une cohorte de 90 jours pour une évaluation réaliste rapport.
- Attribution devrait être simple : conservez les vues du premier contact et de la dernière touche et un mode mixte analyse.
Comment varient les taux de conversion des entonnoirs de vente B2B ?
Efficace optimisation du taux de conversion b2b commence par la clarté de la scène. Chaque étape de l'entonnoir répond à différents leviers. Vous ne pouvez pas tout régler en même temps, alors décidez sur quoi vous concentrer ensuite.
Par étape de l'entonnoir
Commencez par cartographier la façon dont les gens se déplacent dans votre entonnoir. Placez ensuite les plus gros leviers dans le bon ordre :
- Un visiteur à diriger dépend de la qualité de la source de trafic et de l'alignement d'atterrissage. Le référencement avec des sujets correspondant aux problèmes surpasse la publicité au sens large. Le trafic direct et de référence convertit souvent plus que l'affichage à froid.
- Lead to MQL dépend de l'ajustement et du comportement de l'ICP. Utilisez le secteur d'activité, la taille de l'entreprise et la région. Ajoutez des comportements tels que les pages de tarification, les visites répétées et l'engagement par e-mail.
- MQL vers SQL augmente avec la rapidité du lead et du routage. Une équipe qui répond en quelques minutes bat une équipe qui attend des heures.
- SQL to Opportunity reflète la qualité de la découverte. Confirmez la douleur, l'impact et la clarté de la prochaine étape.
- Opportunité de clôture et de victoire est en corrélation avec les preuves, la facilité d'approvisionnement et la clarté du retour sur investissement.
Par industry and motion
Les différents secteurs verticaux et styles de commercialisation modifient la base de référence :
- Les requêtes SaaS se sont réparties entre les versions d'essai et de démonstration : le taux d'activation et les jalons PQL déterminent la pente.
- Des services dépendent de la portée et des propositions : études de cas et les appels de référence renforcent la confiance.
- Les mouvements industriels impliquent des appels d'offres et des spécifications techniques : qui allonge les cycles et les met à un stade avancé conversion plus fort.
- Le commerce électronique dépend de paniers simples et de règles de prix transparentes pour les acheteurs B2B.
Par canal
Les canaux présentent différents niveaux d'intention. Alignez le contenu et les offres sur chaque chaîne pour améliorer les performances :
- Recherche organique augmente l'intention lorsque le contenu correspond à la difficulté de l'acheteur et que la conception de la page est claire.
- Recherche payante peut être plus performant lorsque les mots clés sont serrés. Surveillez la qualité des leads et faites correspondre les promesses publicitaires à la page.
- Courrier électronique et la conversion de référence se situe bien au milieu du voyage. Utilisez des nurtures segmentées.
- Social et LinkedIn faciliter la prise de rendez-vous et influencer bien plus que les volumes de formulaires à remplir.
Par taille d'entreprise
Le vinaigre de cidre de pomme et la complexité créent des modèles prévisibles :
- SMB les cibles indiquent un plus grand nombre de visiteurs en tête mais moins d'Opp en cas de victoire.
- Entreprise les cibles affichent des taux moyens à un stade précoce plus bas et des taux plus élevés à un stade avancé une fois que vous utilisez plusieurs threads.
Quels facteurs influent sur les taux de conversion B2B ?
Votre liste de facteurs devrait mener directement à des expériences. Chaque élément ci-dessous pointe vers un levier que vous pouvez tester.
Qualité et intention du trafic
Commencez par la vérité du haut de l'entonnoir. Un meilleur ajustement du trafic est utile à chaque étape ultérieure.
- Alignez le mot clé à la promesse de destination. Les termes de recherche mal alignés augmentent le rebond et réduisent le taux de formulaire.
- Équilibrez la recherche directe, organique et payante.
- Réduisez les dépenses d'affichage si cela fait monter le nombre de visiteurs sans gagner.
Clarté et segmentation de l'ICP
Les segments sont vos points forts taux de conversion b2b levier car ils focalisent le message.
- Règles d'ajustement des documents, telles que le secteur d'activité, la taille, la région et la pile d'outils.
- Utilisez l'hygiène des sources et l'enrichissement pour normaliser les titres.
- Supprimez les étudiants, les concurrents et les rôles non qualifiés.
Offre, prix et frictions
Les offres ne gagnent que lorsque la friction est inférieure à la valeur perçue.
- Choisissez entre la version d'essai et la démonstration en fonction de la complexité du produit.
- Évitez les murs liés aux cartes de crédit à moins que la valeur ne soit instantanée.
- Réduisez les champs du formulaire et augmentez la vitesse des pages.
- Affichez des signaux de prix transparents et prenez le risque d'une inversion comme des pilotes.
Exécution et processus de vente
Un mouvement de vente rapide et clair augmente les taux en phase de démarrage.
- Répondez en moins de cinq minutes aux formulaires à forte intention.
- Qualifiez-vous en utilisant un langage de douleur, d'impact et de valeur.
- Suivez le comité en utilisant LinkedIn et le courrier électronique.
- Envoyez des propositions avec des résultats et des délais clairs.
L'expérience du produit
L'activation et l'adoption multiplient le retour sur investissement.
- Guidez les utilisateurs vers la première valeur.
- Suivez les fonctionnalités qui génèrent des résultats.
- Définissez des règles PQL simples et surveillez le chemin d'adoption.
Contexte économique et organisationnel
Les frottements externes sont réels. Planifie-le.
- Le gel du budget et la révision juridique ralentissent les transactions.
- Les artefacts de sécurité et les listes de contrôle de conformité aident les entreprises à évoluer.
Données et mesures
Des données propres protègent la qualité des décisions.
- Rédigez des définitions claires pour lead, MQL, SQL et Opportunity.
- Évitez de mélanger des cycles d'un mois pour les PME et des cycles d'entreprise d'un trimestre dans un seul rapport.
- Utilisez Google Analytics et BI pour créer des cohortes et établir des vues sur les fuites par étape.
Quels sont les critères de référence pour les taux de conversion B2B ?
Les points de repère orientent la conversation. Utilisez les bandes ci-dessous pour orienter votre équipe et guider les tests.
Adoptez ces gammes, puis créez des références de segment pour votre secteur d'activité et votre mix de chaînes.
- Un visiteur à diriger est égal à 0,8 à 2,5 % pour la plupart des sites B2B. Les personnes les plus performantes atteignent 3 à 5 % lorsque l'expérience utilisateur est rapide et que les offres sont intéressantes.
- Diriger vers MQL est égal à 20 à 40 % lorsque le score et l'enrichissement sont ajustés.
- MQL vers SQL est de 20 à 35 % avec un suivi rapide et des critères clairs.
- SQL vers Opportunity est égal à 30 à 50 % lorsque la découverte est de qualité.
- Opportunité de gagner est égal à 20 à 35 % lorsque la preuve est solide.
- De l'essai à l'activation dans un délai de 7 à 14 jours est égal à 25 à 45 % avec une orientation solide.
- De l'essai à la version payante est égal à 8 à 20 %. Les résultats exceptionnels atteignent 25 à 40 % avec une valeur claire.
Remarques relatives à l'industrie : Les équipes SaaS suivent les indicateurs de conversion des entonnoirs SaaS, tels que le taux d'activation et les PQL. Les entreprises industrielles mettent l'accent sur la rapidité des appels d'offres et la clarté des spécifications. Les agences et les cabinets de conseil gagnent grâce à la qualité des propositions et à des appels de référence. Les programmes financiers et d'assurance reposent sur la conformité et l'atténuation des risques.
Quel est le taux de conversion moyen des prospects ?
Les dirigeants demandent souvent une conversion moyenne de prospects sans contexte. Évitez toute ambiguïté en nommant le dénominateur et la fenêtre temporelle.
Utilisez les fourchettes ci-dessous dans l'article et dans votre tableau de bord.
- Un visiteur à diriger se situe entre 1 et 3 % pour la plupart des sites B2B, tous secteurs confondus.
- Diriger vers le client se situe entre 2 et 6 %, puis varie selon le ACV et le canal.
- Diriger vers MQL ou SQL dépend de vos règles de notation. Ancrez à 20 à 40 % pour la planification.
Quel est le taux de conversion des appels commerciaux ?
Les responsables commerciaux ont besoin de cibles pour des conversations froides et chaleureuses. Définissez ce que vous mesurez avant de comparer.
Choisissez la métrique qui correspond à votre mouvement, puis testez votre ouverture et votre cadence.
- Kit d'appel à froid pour une réunion est égal à 10 à 25 % selon la qualité de la liste et prix point.
- De la première rencontre à l'opportunité est égal à 30 à 50 % lorsque la découverte est précise.
- Qualifié contre inapte permet d'affiner le ciblage et le script.
Mini-dialogue :
- Rep. Nous aidons les équipes Rev Ops du marché intermédiaire à réduire la préparation manuelle des pipelines. Est-ce que le mardi à 10 heures ou le jeudi à 15 heures fonctionneraient pour une courte visite ?
- L'acheteur. Jeudi à 3 heures, c'est bien
- Le représentant a invité et envoyé un bref ordre du jour
Quel est l'impact du marketing numérique sur les taux de conversion ?
Le marketing numérique peut augmenter ou diminuer les taux de conversion en fonction de l'intention de l'utilisateur et de la clarté de la page. Utilisez cette section pour décider où investir ensuite.
Recherche organique
Le trafic organique excelle lorsque la page résout un problème réel :
- Créez du contenu en fonction des questions des acheteurs et des termes de recherche.
- Utilisez des preuves et un CTA clair pour inciter les visiteurs à remplir les formulaires.
- Surveillez le taux de référencement naturel par groupe d'intention pour guider les agences de référencement et leurs partenaires.
Recherche payante et réseaux sociaux payants
Les programmes payants exigent un contrôle strict et des messages cohérents :
- Associez le mot clé et le texte de l'annonce aux pages de destination.
- Suivez le ROAS et le CAC en fonction des performances de la cohorte.
- Réglez les points négatifs et ajustez les dépenses lorsque la qualité baisse.
E-mail et cycle de vie
Les programmes de cycle de vie évoluent à un rythme intermédiaire :
- Segmentez par secteur d'activité, rôle et récence.
- Utilisez des messages courts qui respectent la lecture mobile.
- Renforcez l'engagement des cohortes d'abonnés inactifs.
Expérience utilisateur et expérimentation du site
Les modifications apportées à l'expérience utilisateur font rapidement évoluer le taux de formulaires :
- Améliorez la vitesse des pages.
- Réduisez les champs et placez le CTA principal au-dessus du pli.
- Ajoutez des preuves sociales telles que des logos et des citations.
- Exécutez des tests A et B simples avec un minimum d'exemples de règles.
Analyses et boucles de feedback
Associez des numéros à un feedback humain :
- Utilisez Google et BI pour suivre les cohortes et suivre l'évolution des étapes.
- Ajoutez des rediffusions de sessions et des commentaires des spécialistes du marketing, des SDR et des CSM pour découvrir les frictions.
Quel est l'impact du marketing numérique sur les taux de conversion ?
Le marketing numérique peut augmenter ou diminuer les taux de conversion en fonction de l'intention de l'utilisateur et de la clarté de la page. Utilisez cette section pour décider où investir ensuite.
Recherche organique
Le trafic organique excelle lorsque la page résout un problème réel :
- Créez du contenu en fonction des questions des acheteurs et des termes de recherche.
- Utilisez des preuves et un CTA clair pour inciter les visiteurs à remplir les formulaires.
- Suivez la conversion organique par groupe d'intentions pour guider les partenaires SEO.
Recherche payante et réseaux sociaux payants
Les programmes payants exigent un contrôle strict et des messages cohérents :
- Match keyword and ad copy to landing pages.
- Track ROAS and CAC on cohort performance, not last click.
- Tune negatives and adjust spend when lead quality slips.
Email & lifecycle
Lifecycle programs move mid‑funnel rates:
- Segment by industry, role, and recency.
- Use short messages that respect mobile reading.
- Build re‑engagement for inactive cohorts.
Website UX & experimentation
UX changes move the form rate fast:
- Improve page speed and Core Web Vitals.
- Reduce fields and place the primary CTA above the fold.
- Add social proof (logos, quotes, short outcome stats).
- Run simple A/B tests with minimum sample rules.
Analytics & feedback loops
Pair numbers with human feedback:
- Use Google Analytics and BI to track cohorts and stage movement.
- Add session replays plus qualitative feedback from marketers, SDRs, and CSMs.
Communities
Peer communities create trust, shorten time‑to‑proof, and often lift mid‑to‑late funnel conversion:
- Where they help: awareness, consideration (AMA threads, office hours), consideration, evaluation (peer set‑up tips, templates).
- Tactics: host AMAs with customers, publish community‑sourced playbooks, create member‑only offers (pilot, extended trial), add “How did you hear about us?” with a Community option for self‑reported attribution.
- Routing: tag community‑sourced leads, prioritize fast follow‑up from reps who participate in the community.
- Attribution: use UTMs for community posts. Track community, landing visitor, lead, lead, MQL, and influenced pipeline.
- Guardrails: keep promos helpful, avoid over‑posting, protect moderation standards.
Influencer & expert partnerships
In B2B, “influencers” are practitioners, analysts, creators, and niche media with credible audiences. Done well, they raise qualified traffic and conversion on related pages:
- Fit first: partner where the audience matches your ICP and pain. Vet engagement quality, not vanity counts.
- Formats: co‑host webinars, teardown videos, or live demos. Co‑write ROI guides, run comparison checklists, invite experts to product clinics.
- Landing & offer: ship a dedicated landing page with a clear CTA (demo, trial, calculator) and matching message to avoid drop‑off.
- Measurement: assign UTMs/promo codes, track visitor, lead, MQL rate, and down‑funnel SQL/Opportunity creation. Capture self‑reported attribution ("saw webinar").
- Compliance: include disclosures, align on claims and brand guidelines.
- Contracts: start with milestones tied to outcomes (content delivered, qualified leads, CPL/CPO pilot) before scaling.
- Anti‑patterns: one‑off posts with no landing, audience mismatch, measuring only impressions.
How to calculate conversion rates with examples?
You cannot optimize what you do not measure. Start with a clean formula and worked examples your team can repeat.
Stage formula
Write this on the dashboard and keep the denominator visible.
- Conversion Rate equals Conversions divided by Total at prior stage multiplied by 100.
- Add the time window next to the number.
- Add the source and channel filters you used.
Funnel example for demo led SaaS
Use a 90 day cohort and run the math stage by stage:
- 50,000 visitor sessions.
- 900 leads which is 1.8% Visitor to Lead.
- 270 MQL which is 30% Lead to MQL.
- 81 SQL which is 30% MQL to SQL.
- 36 opportunities which is 44% SQL to Opp.
- 9 wins which is 25% Opp to Won.
- Overall visitor to customer equals 0.018% which shows how compounding works.
Diagnosis tips: if Lead to MQL is weak, fix scoring and enrichment. If SQL to Opp is weak, upgrade discovery. If Opp to Won is weak, add risk reversal and references.
Channel cohort example
Compare channels inside the same period and segment.
- Paid search: 10,000 visitors, 220 leads, 20 wins.
- Organic search: 20,000 visitors, 260 leads, 25 wins.
Paid hits a higher early rate. Organic carries trust and similar wins from a larger base. Let CAC, roas, and revenue per 1,000 visitors guide spend.
Practical notes
A few process rules make your benchmark report reliable:
- Use cohorts rather than calendar months when cycles are long.
- Set minimum sample sizes before you stop a test.
- Separate SMB and enterprise so patterns stay visible.
- Keep tracking consistent across CRM and web analytics.
For a deeper breakdown of stage-by-stage maths and worked funnel examples, you can use this guide to B2B sales funnel conversion rates to compare your numbers and refine your optimization roadmap.
What are the benchmarks for B2B conversion by channel?
Channel context helps leadership set strategies and allocate advertising budgets.
Recherche organique
L'organique brille au milieu de l'entonnoir lorsque l'intention est réelle :
- Associez les articles aux critères MQL.
- Utilisez des offres de génération de leads qui correspondent à la page.
- Surveillez la conversion par groupe thématique.
Recherche payante
Paid excelle lorsque vous contrôlez étroitement les sujets :
- Utilisez la correspondance exacte pour une intention élevée.
- Protégez-vous contre le trafic de robots et contre les spams.
- Comparez le taux de conversion et le taux qualifié pour décider du budget.
Directe et recommandation
Le trafic direct lié à la marque est faible mais important :
- Attendez-vous à des taux de réunion plus élevés par visiteur.
- Préservez la réputation de votre marque grâce à un contenu cohérent.
Courrier électronique
Le courrier électronique déplace Lead vers le MQL et la rétention :
- Faites en sorte que les messages soient courts et adaptés au rôle ou à l'étape de l'acheteur.
- Titre livré, CTOR, réponse, gagné fermé influencé.
- Respectez la désinscription et la confidentialité.
Réseaux sociaux et LinkedIn
Les réseaux sociaux et LinkedIn créent de l'influence et créent des rendez-vous :
- Interagissez avec des publications basées sur les rôles.
- Utilisez de courtes demandes de rendez-vous plutôt que de longs arguments.
- Enregistrez toutes les touches afin que les ventes et le marketing n'aient qu'un seul historique.
Comment optimiser les taux de conversion des ventes B2B ?
L'amélioration se produit lorsque vous assignez les propriétaires à des étapes et que vous leur donnez des actions claires. Utilisez les listes de contrôle ci-dessous pour optimiser les taux de conversion grâce à de simples modifications.
Visiteur de Lead avec le site CRO
Corrigez la première impression et vous augmentez chaque taux par la suite :
- Alignez les titres avec l'intention de recherche.
- Placez le CTA principal au-dessus du pli.
- Réduisez les champs à l'essentiel et utilisez le profilage progressif plus tard.
- Ajoutez des badges de confiance, des logos, des citations et de brèves statistiques sur les résultats.
- Testez les offres d'intention de sortie et les calculateurs de retour sur investissement interactifs.
Menez au MQL avec notation et enrichissement
Un bon score allie adéquation et intention. Les représentants doivent donc d'abord choisir les meilleurs noms :
- Combinez les données firmographiques et technographiques avec le comportement.
- Enrichissez les titres, normalisez les entreprises et définissez des règles régionales.
- Supprimez les rôles mal adaptés et les désinscriptions récentes.
- Passez en revue le modèle tous les mois avec une équipe des opérations.
De MQL à SQL avec rapidité
Le temps de réponse est la solution la plus facile pour vous :
- Visez moins de cinq minutes sur les formulaires à haute intention.
- Utilisez le mode Round Robin pour que les propriétaires soient clairement définis.
- Mettez un calendrier sur la page de remerciement.
- Exécutez un court schéma de suivi à trois touches sur vos e-mails et LinkedIn.
SQL vers Opportunity avec découverte
La découverte de la qualité permet de résoudre des problèmes plus tard :
- Utilisez la douleur, l'impact, la valeur.
- Confirmez le processus de décision, les parties prenantes, le calendrier et les mesures de protection des coûts.
- Rédigez un plan d'action mutuel et partagez-le par écrit.
Possibilité de clôturer et de gagner sur présentation d'une preuve et d'un achat
Les acheteurs ont besoin de certitudes, pas d'adjectifs :
- Définissez le succès du projet pilote dès le départ.
- Faites intervenir rapidement les aspects juridiques et de sécurité.
- Utilisez des références et des statistiques de retour sur investissement quantifiées qui correspondent au secteur.
- Protégez votre marge grâce à des règles d'approbation claires.
Fidélisation et expansion après la vente
La rétention protège le CAC et augmente le retour sur investissement des dépenses d'acquisition :
- Accédez à la première valeur grâce aux instructions intégrées à l'application.
- Suivez l'adoption des fonctionnalités qui signalent la santé.
- Lancez des programmes de plaidoyer et demandez des témoignages.
- Élaborez des stratégies de renouvellement qui maintiennent la stabilité des revenus.
Aperçu du secteur et tableaux de mixage des chaînes
Tu as déjà vu les grilles. Utilisez-les comme point de départ pour informer les agences et les spécialistes du marketing interne. Remplissez les cellules de référence avec vos propres données Google Analytics et CRM, puis publiez la grille de style des articles dans votre wiki afin que les équipes puissent suivre une seule source fiable.
Comment optimiser les formulaires, les démonstrations et les essais par secteur
SaaS B2B
Les essais doivent atteindre leur valeur rapidement, sinon la pente de conversion s'aplatit :
- Faites correspondre la durée de l'essai à la durée de la première valeur.
- Mettez en évidence les étapes d'activation.
- À utiliser dans les guides d'applications et les courtes vidéos.
- Définissez les règles PQL et informez les représentants lorsque les utilisateurs les consultent.
- Pour payé plans, indiquent des voies de mise à niveau claires liées aux résultats.
Industrie et fabrication
La clarté des appels d'offres permet de passer à un stade précoce sans friction cachée :
- Fournissez des fiches techniques avec les codes de modèle exacts.
- Proposez des contrats de niveau de service liés au chat technique et à la réponse.
- Parcours par territoire et compétence de représentant.
- Confirmez rapidement les délais et les conditions de livraison pour renforcer la confiance.
Services et conseils
La preuve et la portée sont à l'origine de ce mouvement :
- Publiez des études de cas verticales.
- Partagez une feuille de travail de cadrage qui qualifie le calendrier et le budget.
- Fixez des délais de proposition transparents.
- Ajoutez une étape d'appel de référence avant la signature finale.
Commerce électronique B2B
Les acheteurs veulent passer des commandes rapidement et bénéficier de conditions claires :
- Afficher les prix par niveau et par volume.
- Autorisez le paiement rapide des clients grâce à la création d'un compte optionnelle.
- Soutenez des flux de prix négociés simples à utiliser.
- Exécutez des séquences d'abandon de panier avec des rappels de valeur.
Quels indicateurs suivre en plus du taux de conversion ?
La conversion à elle seule n'est pas une stratégie. Associez-le à performance et qualité des points de vue auxquels les dirigeants ont confiance :
- Vitesse, qui correspond au temps passé étape par étape.
- Taux de réussite selon le secteur d'activité et la taille de l'entreprise.
- Précision des prévisions et couverture du pipeline.
- Efficacité telle que le CAC, le retour sur investissement, le coût par opportunité et le ROAS par canal.
- Qualité telle que la taille de la transaction, les raisons des pertes, la profondeur multithread et l'adoption après la vente.
Si vous souhaitez approfondir les mesures d'efficacité, Guide du coût par prospect B2B explique les formules CPL, les benchmarks et la manière de réduire les coûts d'acquisition sans nuire à la qualité du pipeline.
Comment aligner les ventes et le marketing sur les définitions et les rapports ?
L'alignement supprime les arguments bruyants et accélère l'action. Mettez les contrats par écrit pour que la prochaine recrue apprenne rapidement. Concevez des contrats d'une page et actualisez-les tous les mois.
- Définitions partagées pour lead, MQL, SQL, opportunity et closed won.
- Règles de propriété applicables à ventes et marketing pour chaque scène.
- Gouvernance mensuelle pour ajuster le score et le routage en fonction de commentaires et suivi.
- Rapports de cohorte et fuite de stades pour s'assurer que les chiffres ne sont pas gonflés.
- Un tableau de bord BI issu du CRM et du Web avec les dénominateurs correspondants.
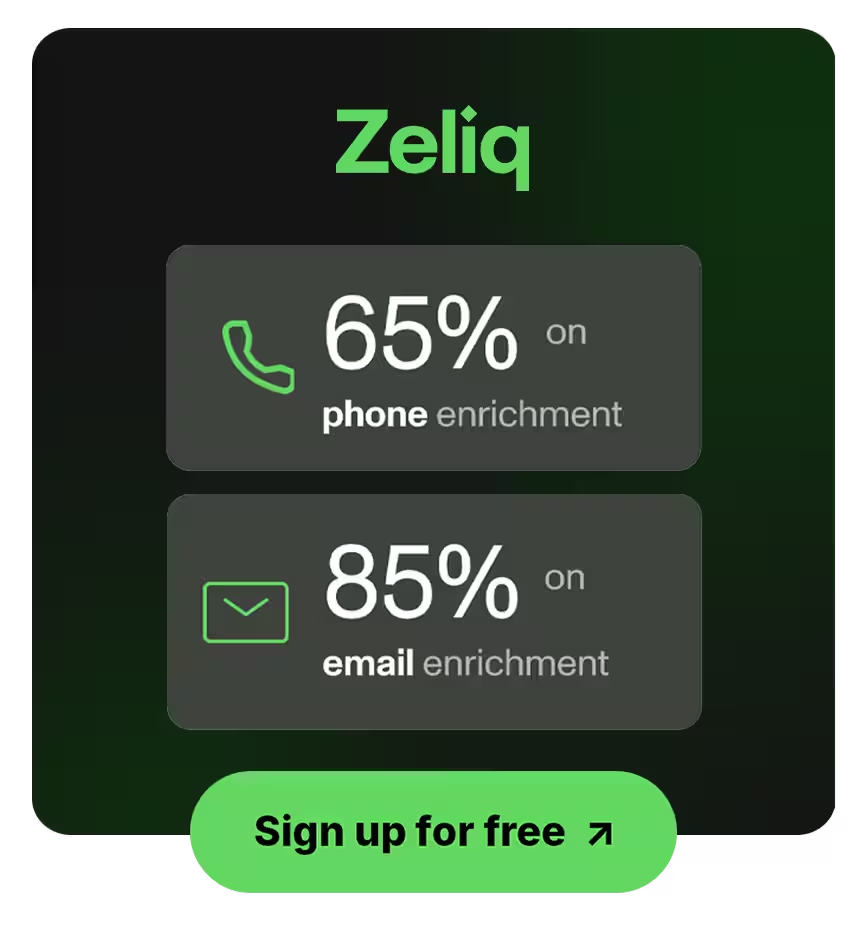
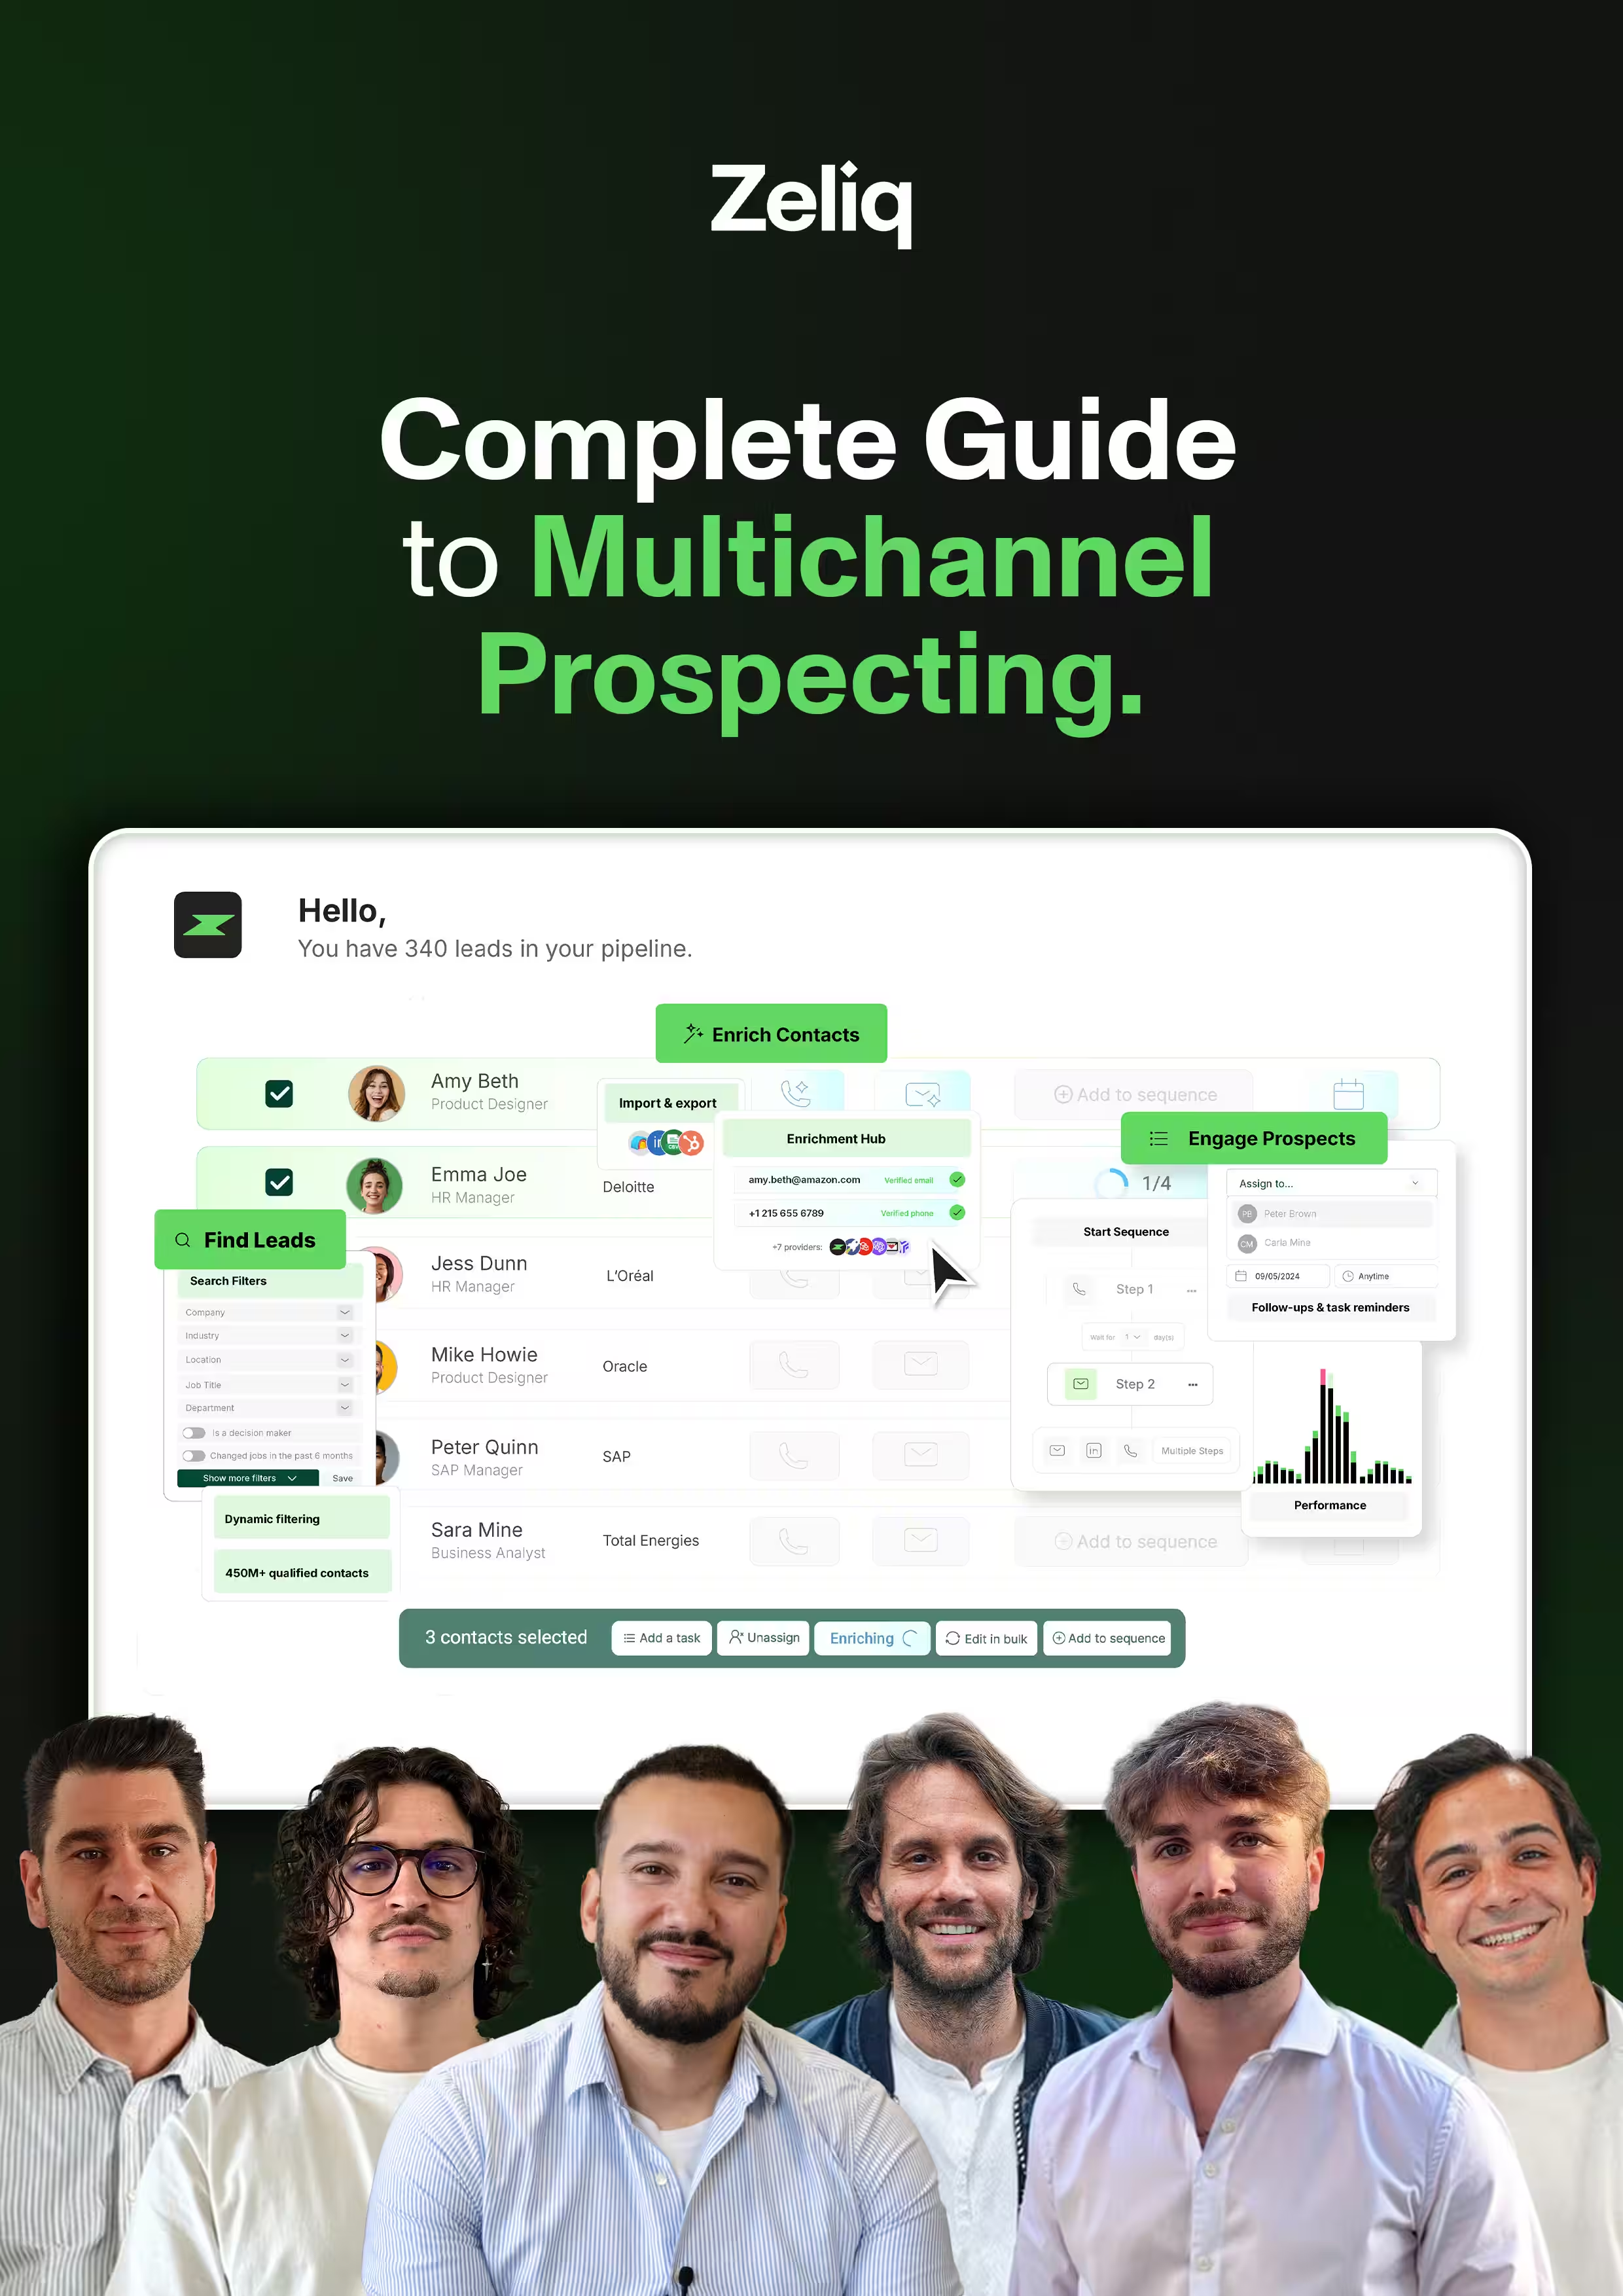
Où ZELIQ soutient le plan ?
ZELIQ est une plateforme de sensibilisation et de prospection destinée aux équipes commerciales. Utilisez-le pour :
- Recherche ZELIQ: trouvez des prospects à l'aide de filtres tels que le secteur d'activité, la taille de l'entreprise et la localisation (éventuellement rôle/pile technologique) pour créer des segments ICP‑Fit plus rapidement.
- Nettoyez les segments par pression directement dans les séquences de sensibilisation.
- Protégez la santé de l'expéditeur avec des limites tactiles par e-mail et des commandes de préchauffage.
- Synchroniser les résultats des réponses avec le CRM (ouvertures, réponses, réunions, disqualification) afin que chaque rapport affiche un historique.
Résultat : une visibilité plus claire des conversions B2B de bout en bout sur l'ensemble du funnel, sans étendre les outils.
Enter the future of lead gen
Table of contents
Placeholder Title
Table of contents
Placeholder Title
Placeholder Title